Article Summary
OvalEdge has several tools to assess the quality of data in the system. The profiled data statistics give insights to a user about the basic data characteristics, such as minimum value, maximum value, top values, Density, Null Density, Unique values, Null values, etc.
Each data object also has a data quality score. Clicking on the “Quality Index” in the Object Summary page takes the user to the detailed data quality screen while clicking on the “Report Problem” enables a user to create a Service Desk ticket for the data quality issue.
Access Privileges
Users need to have an Author or Admin privilege to access the Data Quality screens. Viewers and Contributors can not even access the Data Quality screens.
Data Quality Functions
Data Quality Functions are the analytical functions that can be used to compute required calculations on the numerical data or do logical operations on the alphanumeric data (validations).
OvalEdge has 56 predefined Data Quality Functions for various computations. These functions can be run specifically on Tables (TB), Table Columns (TC), Files (FL), File Columns (FC), or SQLs (SQL).
Data Quality Functions in OvalEdge
|
Object |
Default Dimension |
Data Quality Function |
|
Tables |
Completeness |
Null Density Percent (TB) |
|
Uniqueness |
Density Percent (TB) |
|
|
Validity |
Total Row Count (TB) |
|
|
Table Columns |
Completeness |
Null Density Percent (TC) |
|
Empty Or Null Count Percent (TC) |
||
|
Not Null And Not Empty Percent (TC) |
||
|
Uniqueness |
Density Percent (TC) |
|
|
Validity |
Validate Email Percent (TC) |
|
|
Validate Regex Percent (TC) |
||
|
Validate Pattern Percent (TC) |
||
|
Outlier Rule (TC) |
||
|
Is Unique Column (TC) |
||
|
Empty Count Range (TC) |
||
|
Not Empty Count Range (TC) |
||
|
Data Length Range (TC) |
||
|
Validate SSN Format (TC) |
||
|
Validate Credit Card Format (TC) |
||
|
Ends With Symbols (TC) |
||
|
Average (TC) |
||
|
Distinct (TC) |
||
|
Min (TC) |
||
|
Max (TC) |
||
|
Null Count Range (TC) |
||
|
Std Deviation (TC) |
||
|
Sum (TC) |
||
|
Top Values (TC) |
||
|
Files |
Validity |
File Name Contains (FL) |
|
File Format Validation (FL) |
||
|
File Created Date (FL) |
||
|
File Size Validation (FL) |
||
|
File Row Validation (FL) |
||
|
File Columns |
Validity |
All Column Values Matches Given Fixed Value (FC) |
|
First Letter Of Word Upper Case And Rest Lower Case (FC) |
||
|
This Column Value Should Be Unique (FC) |
||
|
Word Validation (FC) |
||
|
Number Validation (FC) |
||
|
Date Validation (FC) |
||
|
Numeric Value Between Min And Max Values (FC) |
||
|
Value Validation (FC) |
||
|
Allow Only Specified Special Character (FC) |
||
|
Has Length Of The Value With In Range (FC) |
||
|
Columns Unique Percent Value (FC) |
||
|
Outliers To Aggregations (FC) |
||
|
Has No Null Value (FC) |
||
|
Has No Digits or Special Chars (FC) |
||
|
Has Digits and Special Chars (FC) |
||
|
No Leading or Trailing Spaces (FC) |
||
|
Has Substring in String (FC) |
||
|
Belongs To One Of Languages (FC) |
||
|
Word Count With In Range (FC) |
||
|
Column Value Same As Other Column Value (FC) |
||
|
Regex Match (FC) |
||
|
Column Value Matches One Of Given Values (FC) |
||
|
Query |
Uniqueness |
Sql Exact Value (SQL) |
Validity |
Custom Sql Exact Value (SP) |
|
|
Sql Value Contains (SQL) |
||
|
Sql Value Range (SQL) |
Note: A detailed explanation of the Data Quality Functions and the Rules is given in the “in-line” help of the OvalEdge application and for more information on the Data Quality Functions, please refer to the OvalEdge Data Quality Functions article.
Data Quality Rules
Data Quality Rules are rules with user-defined criteria to measure the results of the data quality functions for their conformance to the user requirements. The rules usually take a lower value and an upper value as the input success range to compare the results. In some cases of alphanumeric validations, they will not take any input values. Some rules give the failed values and statistics on failure of the rule.
OvalEdge has the functionality to Send Alert On Failure (to those listed in the “Contacts” page), Create Service Request On Failure, Caution Downstream Objects on Failure, and Add Failed Rows To Control Center (only for those rules which return the failed values, and this functionality comes up only after creating the rule).
OvalEdge also has predefined Data Quality Rules to run on a selected data object.
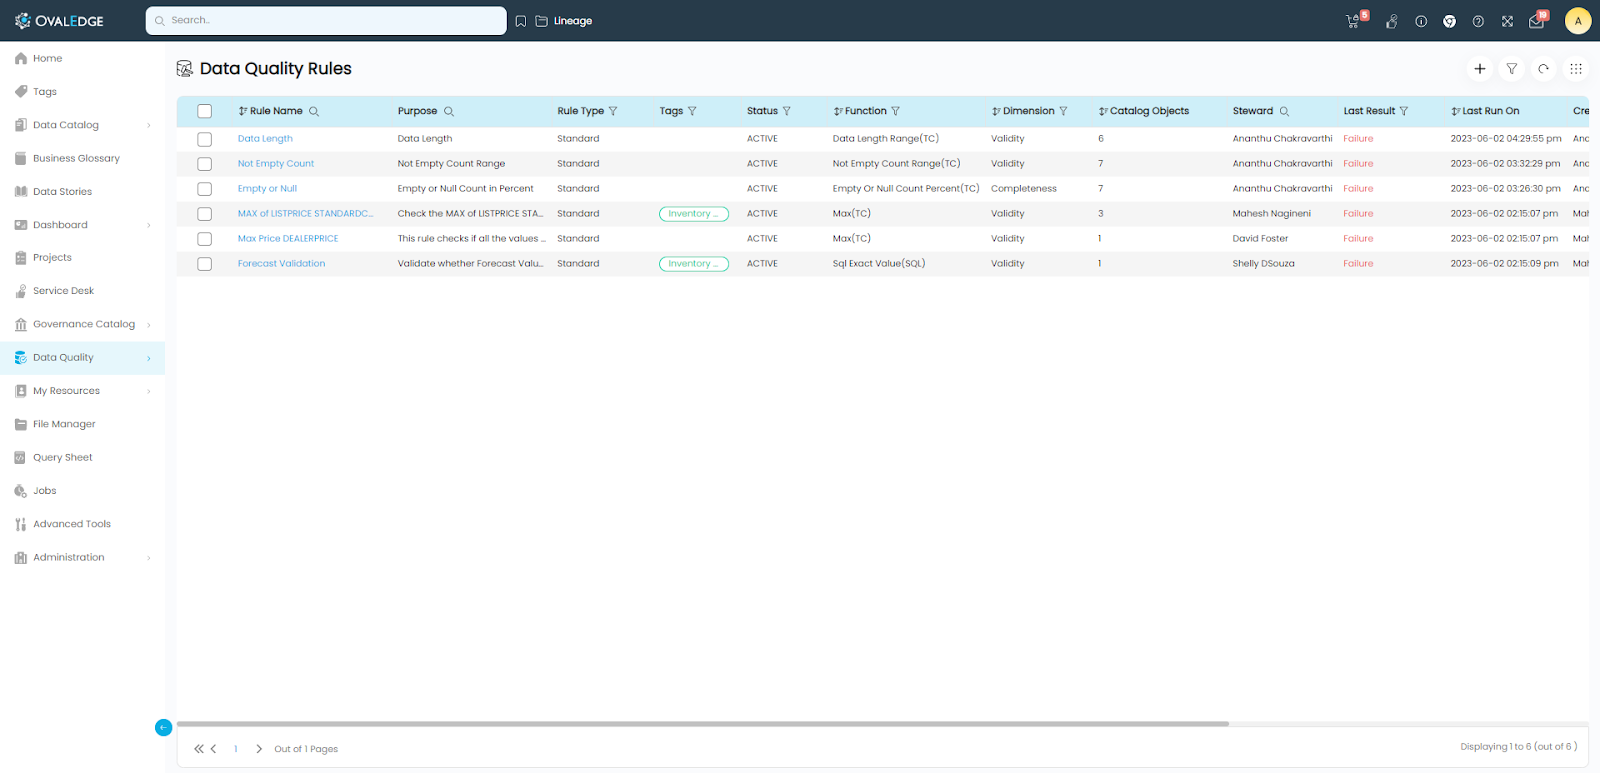
Data Quality Rules screen
From the left panel menu, click on “Data Quality > Data Quality Rules”.
Adding New Rule
Click on “+” (Add New Rule) to add a new rule. This will bring up the window as shown below:
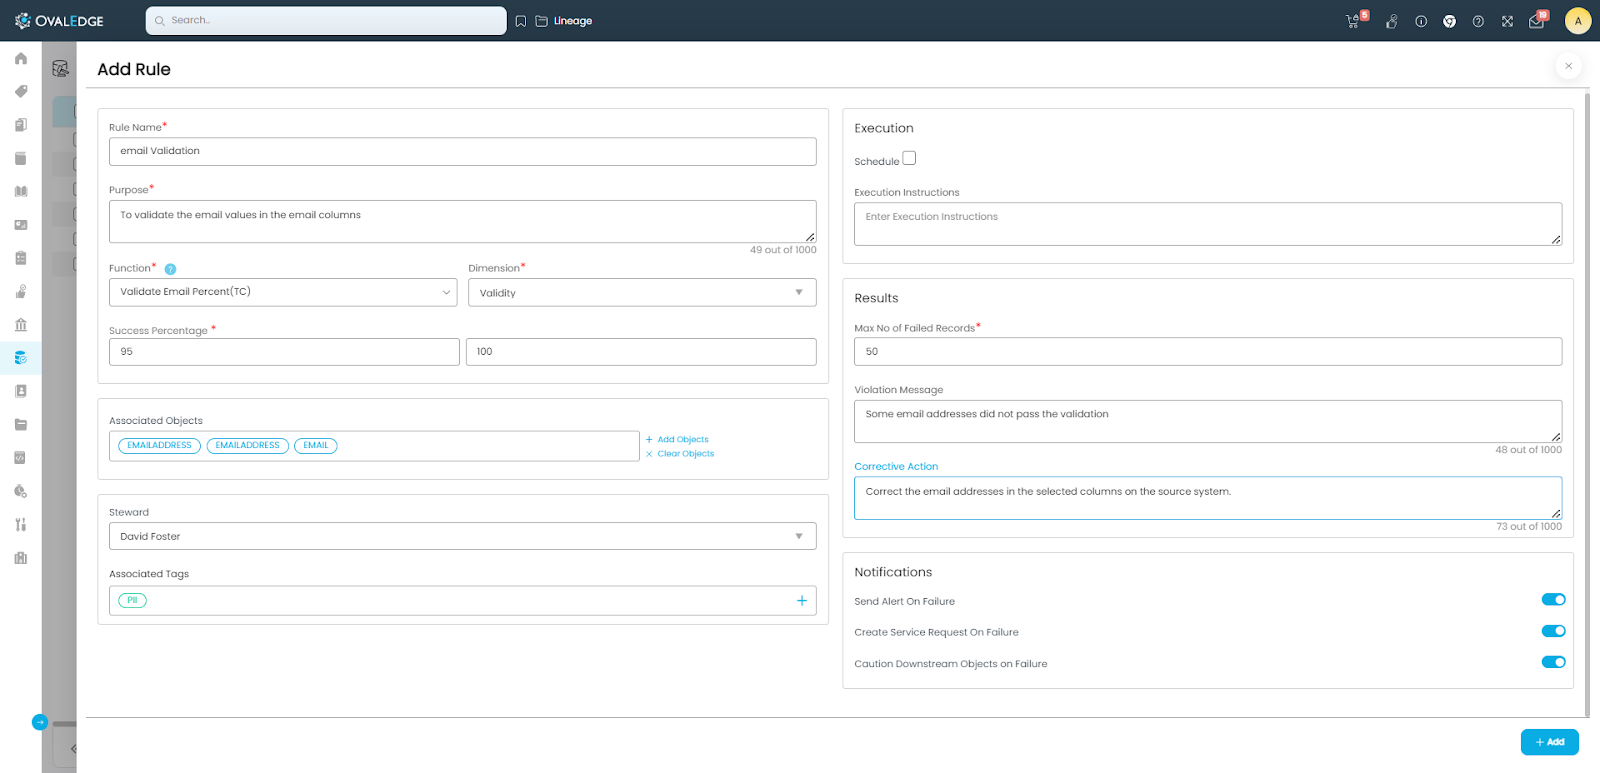
The user will need to enter the Rule Name and Purpose, and select the required data quality function from the list of predefined functions available in the application. Data Quality function is a computational function that will do the intended calculation on the required data object and provide the result. Default Dimension of the selected function will be shown in the Dimension drop-down, but can be changed to whichever dimension the user wants.
The lower and upper values for Success Percentage or Success Range shall be specified by the user, against which the value(s) returned by the data quality function is compared and the rule’s passing or failure is determined.
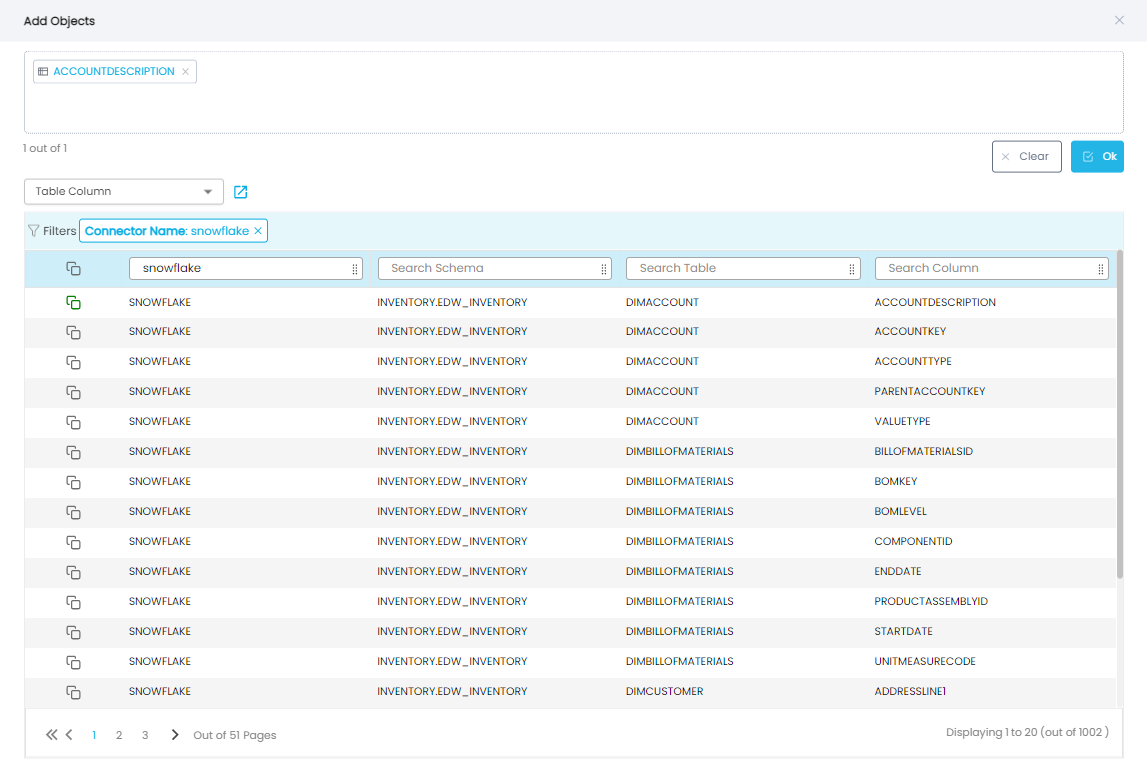
Clicking on the “+ Add Objects” link brings up a screen in which the data objects can be selected to run this rule on. On this screen, short-listing of objects can be done by specifying the Connector, Schema, and Object Names.

Selection of object can be done by clicking on the row corresponding to that object or clicking on the symbol. Click “Ok” button to add the selected objects to the rule. In the “Add Rule” screen, click on the “+ Add” button to add the new rule.
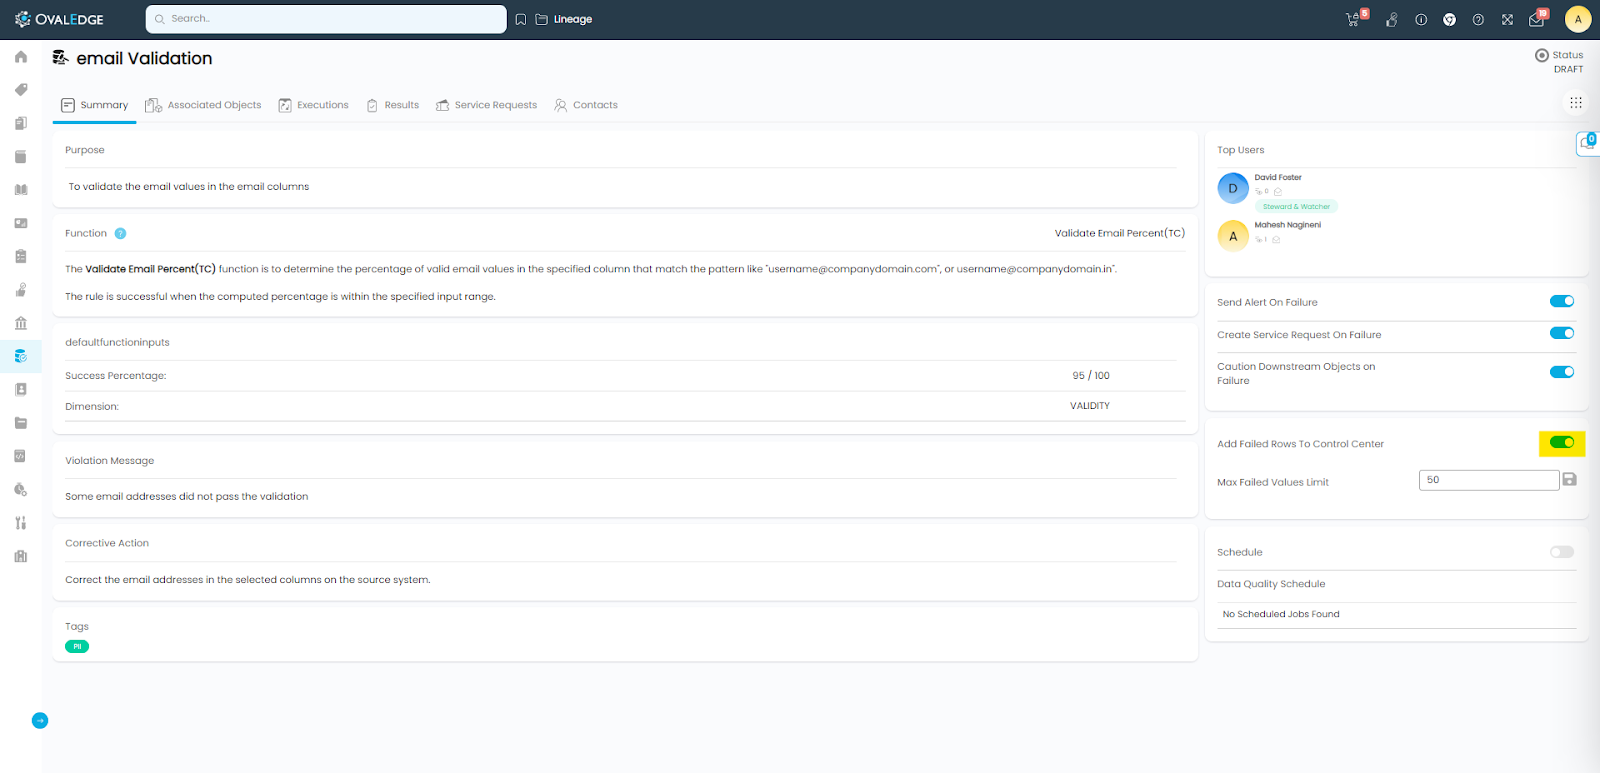
Running the Rule
Click on the newly added rule name link, and open the rule. The rules that fail can be added to the “DQ Control Center” for a user to analyze and correct on the source system. In order to add these records to the Control Center, “Add Failed Rows To Control Center” toggle button should be set to “ON” (Note: Please note that this toggle button shows up only after adding the rule first).
Click on “9 Dots” () and select “Change Status to Active” to activate the rule. Click on “9 Dots” (
) and select “Run Now” to run the rule. This will initiate a job on the source system. Once the job completes, it will report the results on the rule summary page.
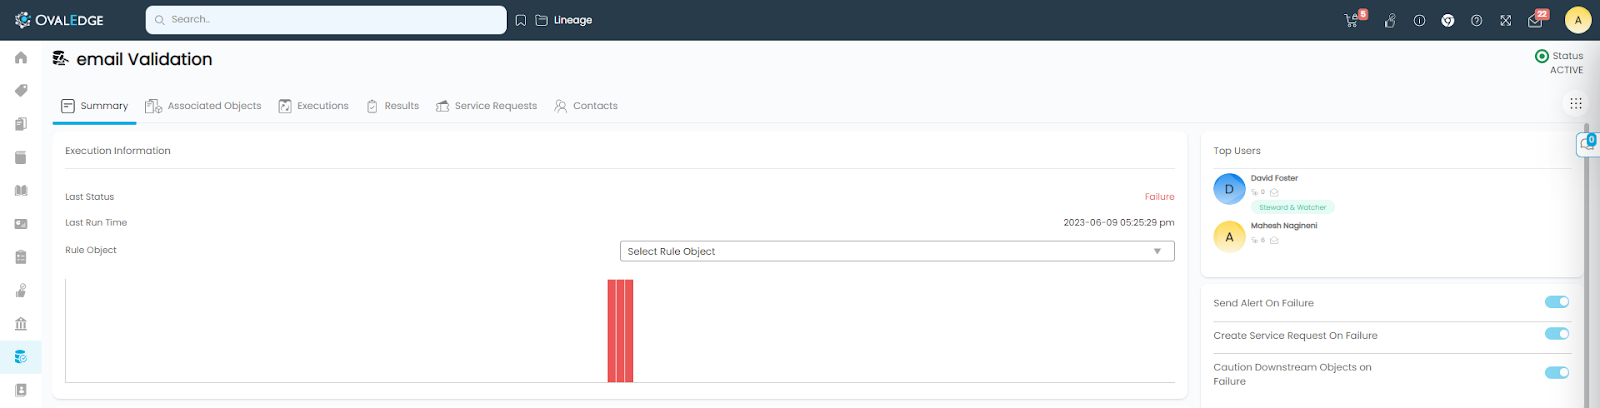
“Results” page will show the “Failed Row Count” and its percentage.

Since the “Add Failed Rows To Control Center” toggle button was set to “ON”, these failed rows will be added to the “DQ Control Center” screen. Please see the “DQ Control Center” section for more information and the remediation process.
Data Quality Objects
The purpose of the “Data Quality Objects” screen is to run multiple rules on a single data object. Navigating to “Data Quality > Data Quality Objects” will open the screen shown below. The screen will have the functionality to drill-down for the Connector, Schema, and the data objects. The application lets the user select only one data object by clicking on the corresponding row or the symbol.
Once the data object is selected, all the available predefined rules for that data object type are shown in the list.
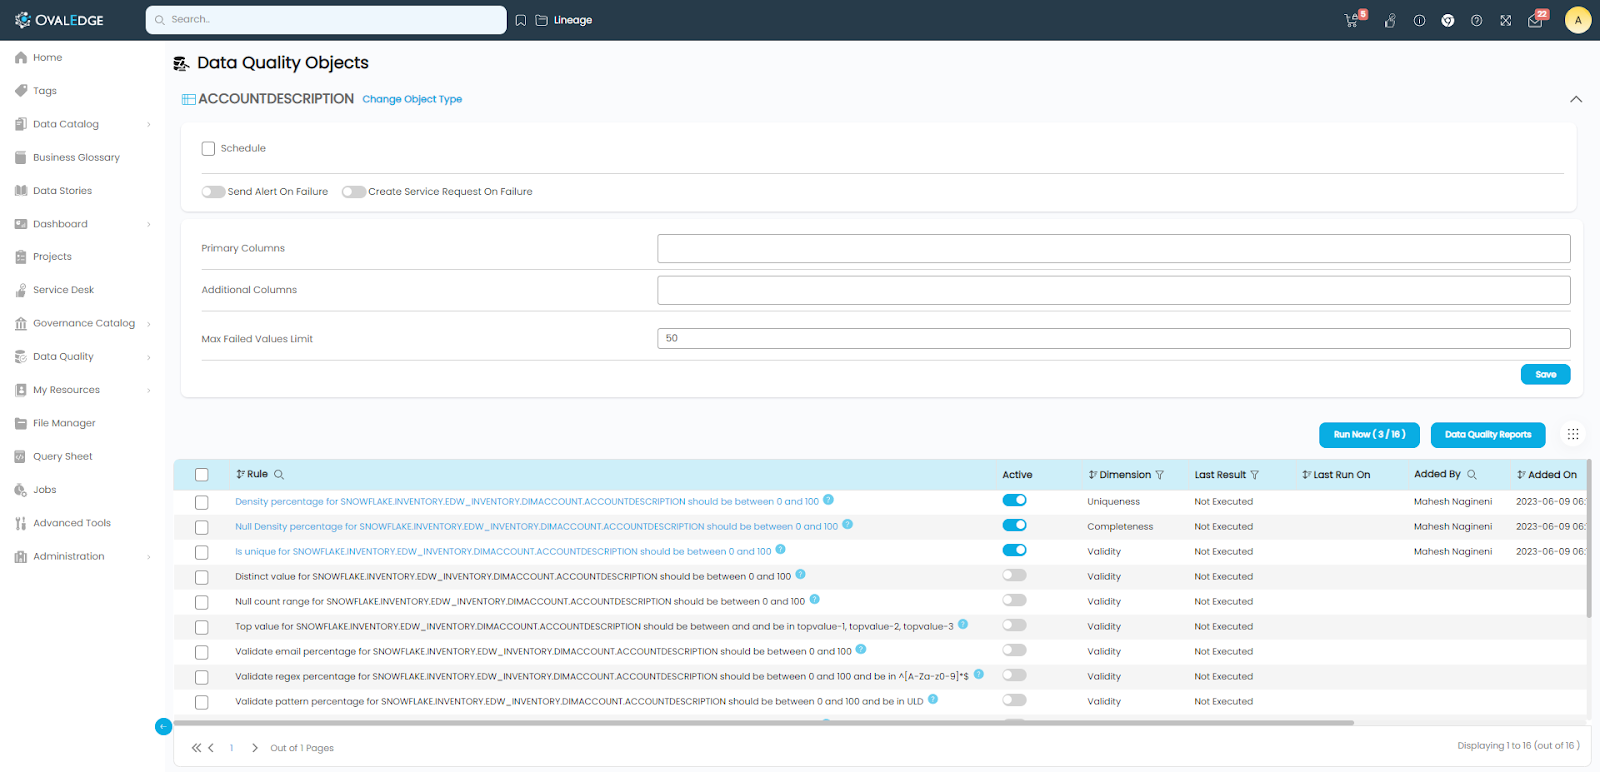
For the required Data Quality Rules to be run on the selected data object, set the “Active” toggle button to “ON”. The name of the rule(s) of interest will become clickable links. If the user wants to change the success criteria for each rule, s/he needs to click on each link, change the rule to draft mode, set the success percentage / range to the required values, and activate the rule.

After doing the changes to all the rules required, click on the “Run the Rule” to run the rule now (or schedule it as per requirement). Upon confirmation to run the active rules, a job is submitted. Once the job is completed, a user can click on the “Data Quality Reports” button to see the results of the job that was completed.

DQ Control Center [Beta]
When the Data Quality rule that gives the failed values on failure, is run with the “Add Failed Rows To Control Center” toggle button set to “ON”, these failed rows will be shown on the “DQ Control Center” screen. The Custodian of the corresponding data object will be assigned as the assignee for remediating the data. Assignee can remediate the data quality issue or he can change the assignment to somebody who can.
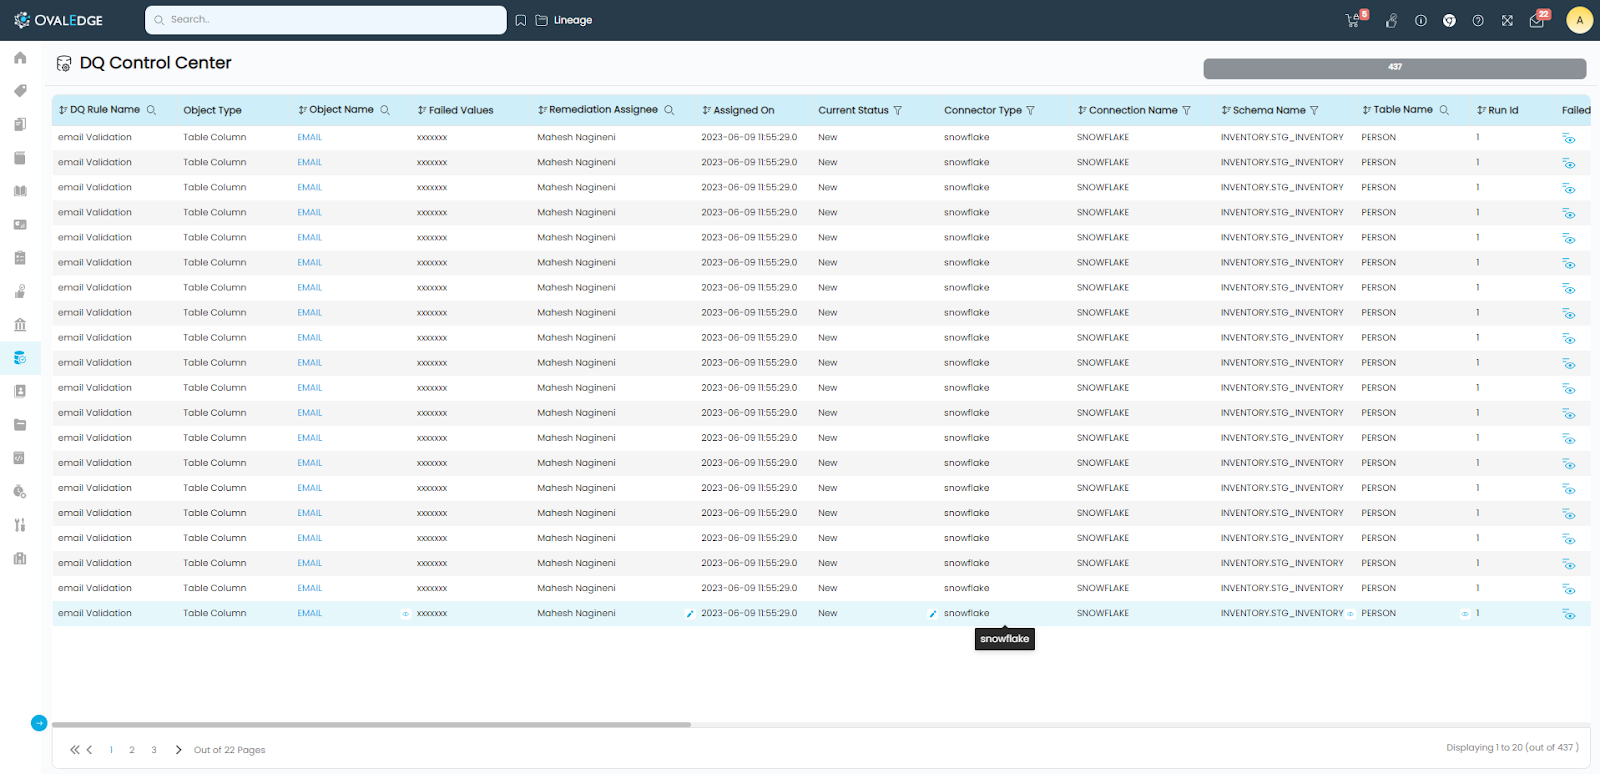
Remediation Procedure
Some of the failed values, such as those failed in the email validation rule can be corrected in the source system. Clicking on the View Link of “Failed Values” will show the failed value(s) for that row. Clicking on the View Link of “Remediation Tools” will show the Remediation SQL statement that would help in identifying and remediating the data on the source system. These SQL statements can be precise with the filter conditions or sometimes filter conditions need to be added in the placeholder of the SQL statement.
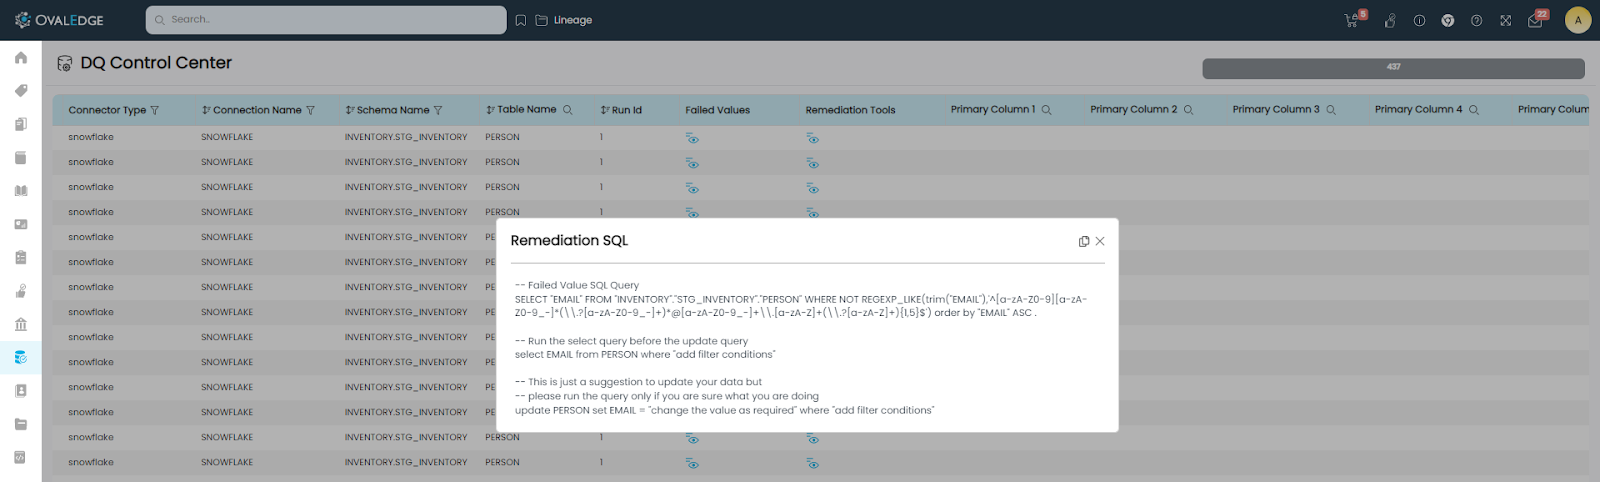
The Remediation SQL statement can be executed on the source system to remediate the error, and the status of the failed value row can be edited and set to an appropriate status (In Progress / Resolved / Closed).
Data Anomalies [Beta]
Data anomalies refer to unexpected or irregular patterns, variations, or inconsistencies in data that deviate from the normal or expected behavior. Anomalies can occur due to various reasons, including errors in data collection, data entry mistakes, system failures, or intentional manipulations. Detecting and understanding data anomalies is important for maintaining data quality and ensuring accurate analysis.
OvalEdge currently detects data anomalies in the following way:
- Deviations: This involves analyzing the variations or deviations from expected patterns in data to identify anomalous or outlier data points. Profiled data is compared with the previously profiled data, and if it deviates more than the threshold value on the upper side or lower side , an anomaly record is created.
Data Anomaly Detection using Deviations
Data Anomaly detection mechanism uses the configuration parameter “anamoly.detection.analysis.deviation.threshold” (with default value 50) in the “System Settings > Others” tab. User can change the default value as per the requirement to the percentage value beyond which on the upper side or lower side compared with the previous profiled value, the anomaly is raised.
For example, a table has 100 rows when profiled last time. Let’s say the “anamoly.detection.analysis.deviation.threshold” has the value 50 (same as default). If the currently profiled rows are 50% above the last value ( > 150) or 50% below the last value (< 50), the application tags it as an anomaly.
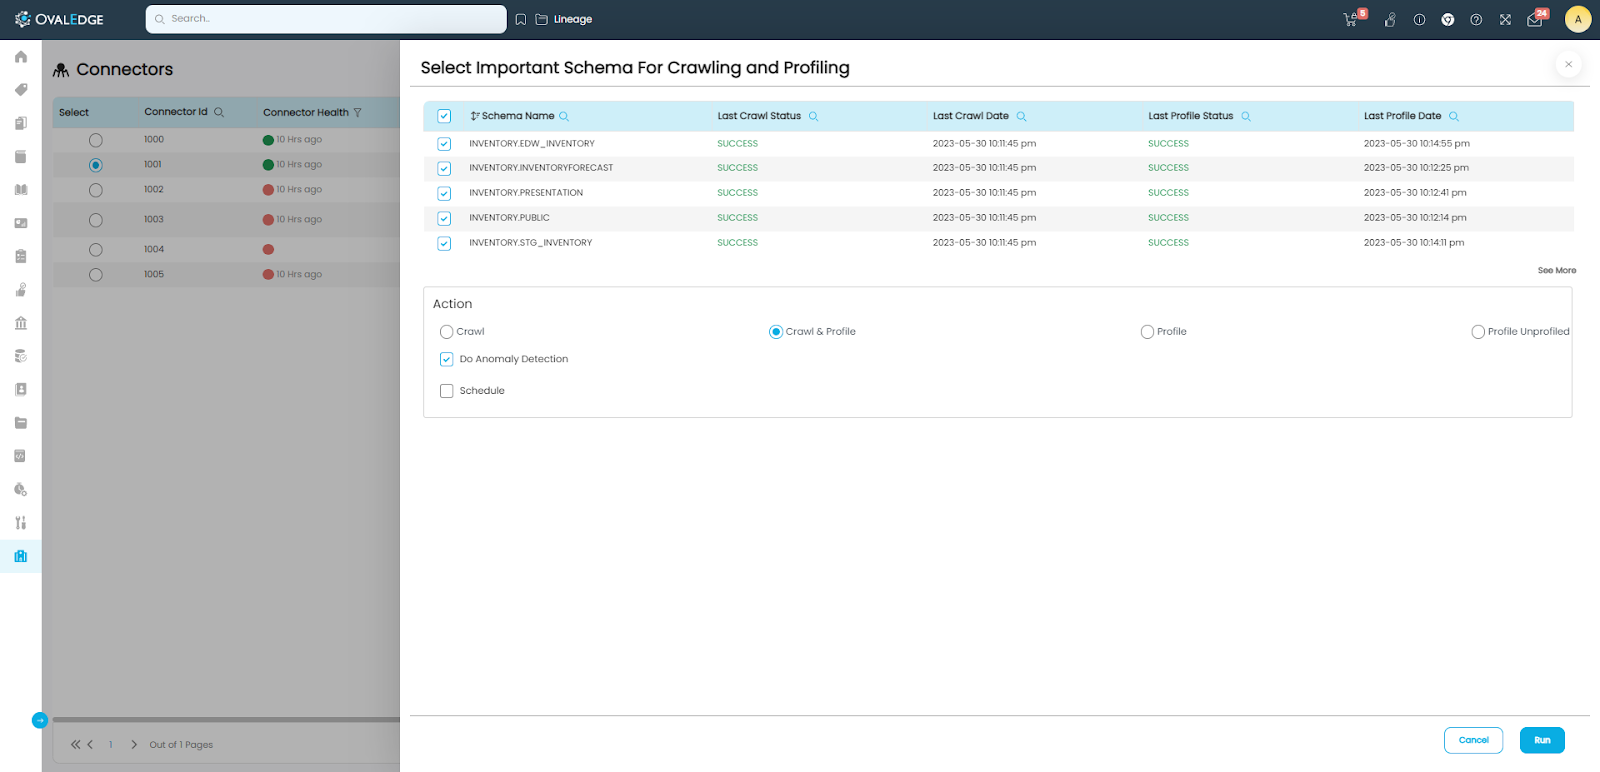
To run the anomaly detection on the data pertaining to a connector:
- The user needs to select the Connector and click on the “Crawl/Profile” button.
- Select the Schema(s) on which the anomaly detection should happen.
- Under “Action”, select “Crawl & Profile” or “Profile”, which makes the “Do Anomaly Detection” check-box appear.
- Check the “Do Anomaly Detection” check-box and click on the “Run” button.
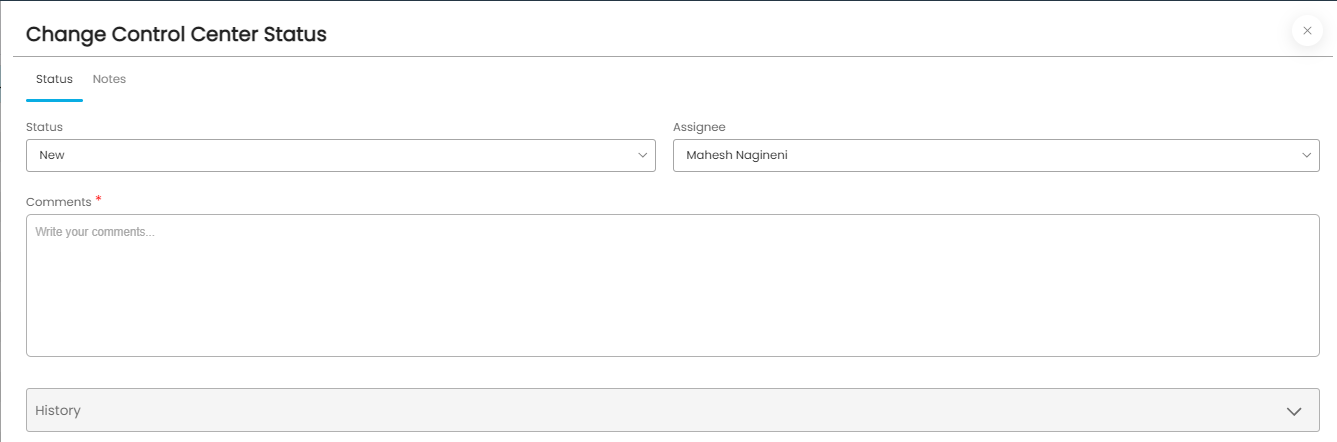
Action on the Data Anomalies
Once the anomalies are identified, the Custodian of the corresponding data object will be assigned as the assignee for taking action. Assignee can remediate the data quality issue if required or he can change the assignment to somebody else.
The assignee should go through each anomaly and analyze further to find the reason. If the reason is ignorable and doesn’t need any action from the assignee’s side, s/he can set the status accordingly and leave it. If the anomaly needs some action, the assignee should do the corrective action on the source system and set the status to the respective one (among DQ Issue Reported, Resolved, Ignored, Closed).
Data Quality Dashboards
Dashboard > Data Quality > Data Quality Dashboard provides a visual overview of the,
- Service Desk Data Quality Report by month (Service Desk tickets created and resolved)
- Success/Failure statistics of the Data Quality Dimensions.

Dashboard > Data Quality > Data Quality Scores provides the available overall data quality scores of the schemas in each connector.
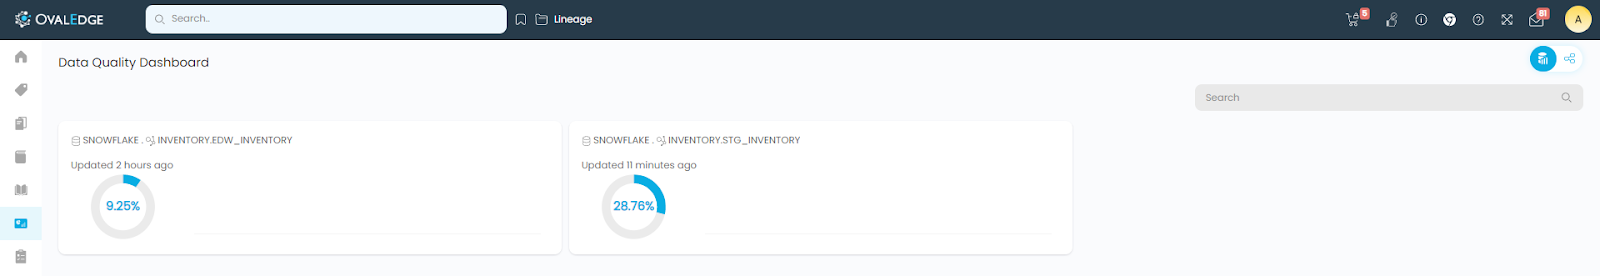
Clicking on the schema name will give the detailed information about the scores.

Further, clicking on the Table name in the left panel will get the score of that particular table.
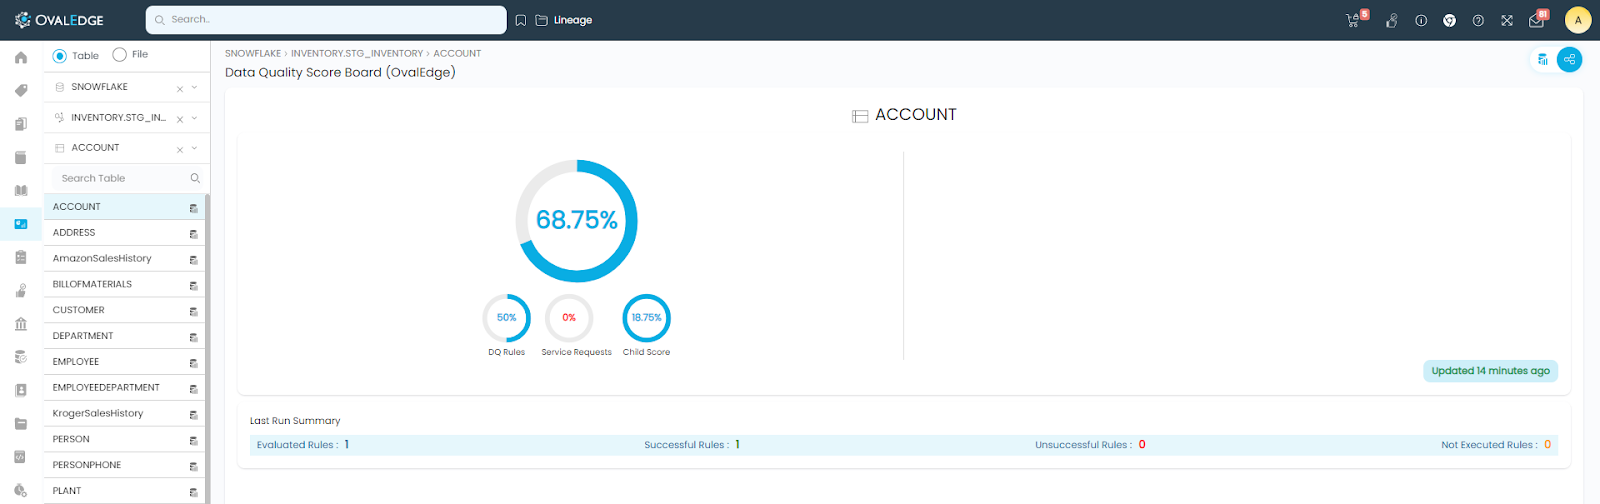
Similarly, clicking on the Table Column name in the left panel will show the score of that particular table column.
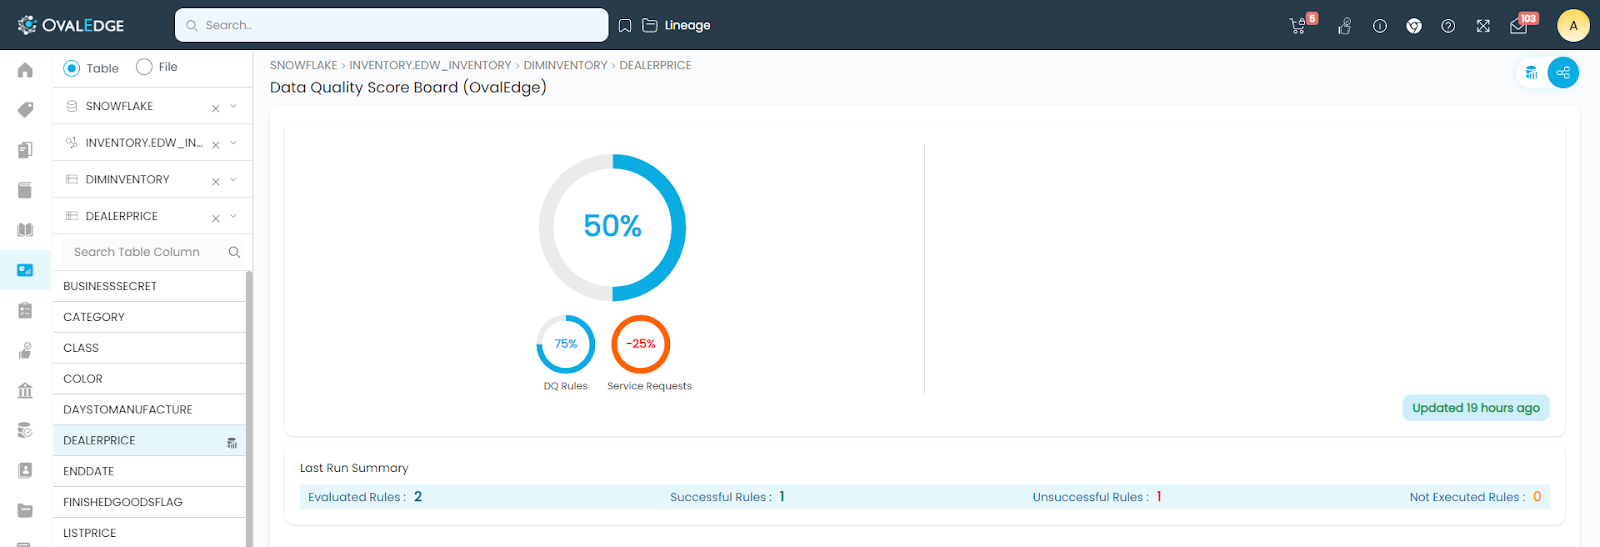
Data Quality Score of each data object is the weighted sum of its scores from Data Quality Rules, Service Requests, and an average of the Child object scores. The computation process is explained in detail in the document Data Quality Score.
Conclusion
In this article, we have examined how the data quality is measured in OvalEdge, how anomalies are reported and the process to remediate them.
Copyright © 2023, OvalEdge LLC, Peachtree Corners GA USA