Article Summary
In this article, we will explore how the data quality score of a data object is calculated. We will discuss the different factors that are considered during the calculation process, aiming to provide a clear understanding of how this score is determined.
Data Quality Score
The Data Quality score can be calculated by running the data quality rule on the fly or by scheduling it on a periodic basis. This calculation is based on multiple parameters. An object’s data quality score is calculated by considering the following:
-
Data Quality Rule Score: This is computed from the results of the Data Quality rules executed on a data object.
-
Service Request Score: This is computed from Data Quality service requests raised and resolved on a data object.
-
Child Score: Data Quality Scores of the associated child objects (for e.g. table column is a child object to a table).
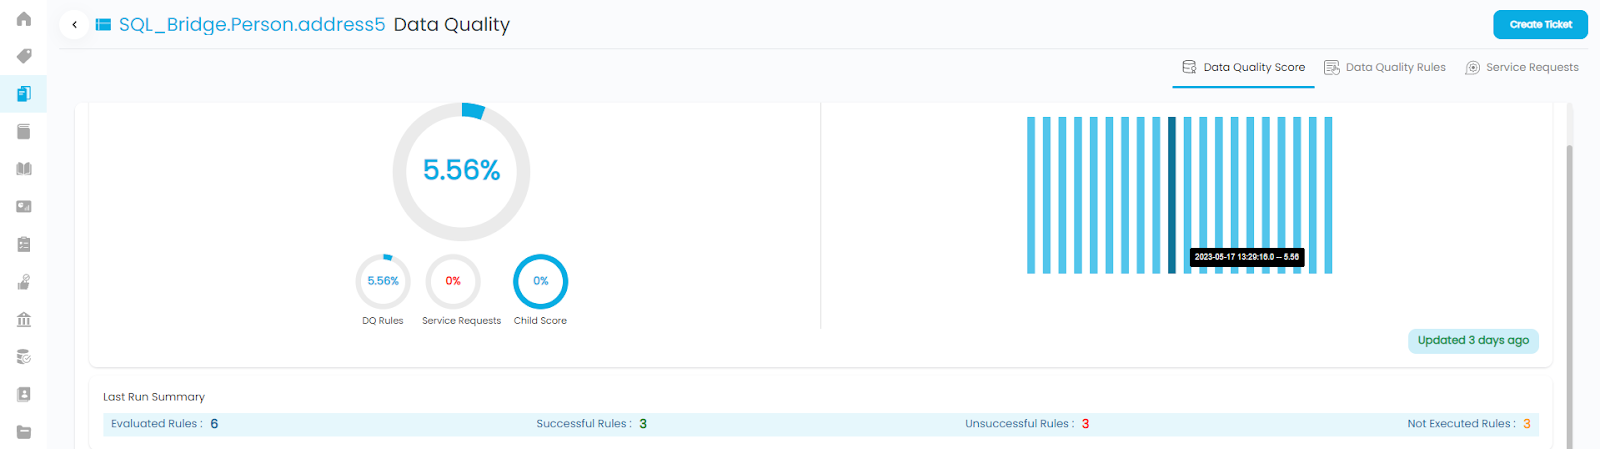
Accessing Data Quality Score
In the OvalEdge application, a user can access the data quality score of a specific data object from the following sections:
-
Data Catalog: Navigate to the data object summary page and click on the “Quality Index” link.
-
Data Quality Dashboard: Navigate to “Data Quality > Data Quality Scores” and click on the appropriate object.
Data Quality Rule Score
Data Quality rules play a vital role in evaluating data quality. These rules are generally user-defined (Data Quality Rules page) and some predefined for each data quality function to run on the selected data objects (Data Quality Objects page). Each rule will have a predefined data quality function associated with it, sometimes input value to validate against based on the function selected, and usually has a user-defined success range (either in percentage or in values) defined for that rule. Based on the results provided by the data quality function, the data quality rule assesses the success or failure of the rule. Data Quality rules can include checks for the data quality dimensions, such as accuracy, completeness, consistency, uniqueness, etc.
Data Quality Rules carry a weightage of 50% by default in the data quality score calculation, indicating their significant influence.
Data Quality Rule Calculation
Calculating the Data Quality Rule score involves three cases:
-
The rule is a success.
-
The rule is a failure with statistical information.
-
The rule is a failure with no statistical information.
|
Data Quality Rule Outcome |
Resulting Weightage |
|
The rule is a success |
1 |
|
The rule is a failure with statistical information. |
Passed Values/Total number of values |
|
The rule is a failure with no statistical information. |
0 |
Let’s take an example in which the rules A, B, and C ran on their corresponding data objects.
-
Rule A was successful. Hence, its weightage factor is 1.0.
-
Rule B was a failure and with no statistical information. Hence, its weightage factor is 0.
-
Rule C was a failure and has the statistical information that the function has passed on 2,000 columns out of the total 10,000 columns. Hence, its weightage factor is 0.8.
Service Request Score
The Service Request Score represents the impact of active service requests on a particular data object. Whenever a Data Quality Rule fails a service request ticket is either created automatically by the rule or manually created by the user. This service will help users in addressing the data quality issues within a data object. The Service Request Score holds a negative weightage of 25% by default, and is configurable in “System Settings”. This means that a better Service Request Score (having less number of outstanding service requests) results in a lesser negative impact on the overall data quality score.
Child Score
The Child Score evaluates the quality of associated child objects, such as Table columns within a Table. If child objects are present, they contribute a default weightage of 25% to the assessment. If there are no child objects present, the weightage (25%) is added to the Data Quality rules, resulting in an increased weightage (from 50% to 75% by default) for these rules in the computation of the overall data quality score. This adjustment underscores the importance of Data Quality rules and emphasizes their significance.
Note: If the client wants to increase or decrease the importance of any of the components of the data quality score contributors, the weightage of the scores can be configured in “System Settings > Others”. Here are the OvalEdge’s default weightage values:
Parameter Weightage (%)
dq.dashboard.dqrscore.weightage 50
dq.dashboard.srscore.weightage 25
dq.dashboard.childscore.weightage 25
Age Factor
In addition to the above metrics, the age of the Data Quality Rule or the Service Request raised will also be considered for the data quality score calculation. The objective is to ensure that the Data Quality Score is as recent as possible to give an accurate perspective of the quality. The older the quality data, the lesser its impact. The Table below will illustrate the age factor multiplier, which each element is multiplied with to compute the scores.
|
When was the DQ rule Executed or SR was raised? |
Age Factor |
|
1 to 30 days ago |
1 |
|
31 to 60 days ago |
0.9 |
|
61 to 90 days ago |
0.8 |
|
91 to 120 days ago |
0.7 |
|
121 to 150 days ago |
0.6 |
|
151 to 180 days ago |
0.5 |
|
181 to 210 days ago |
0.4 |
|
211 to 240 days ago |
0.3 |
|
241 to 270 days ago |
0.2 |
|
Over 271 days ago |
0.1 |
How is the Data Quality Score Calculated?
The Data Quality score is determined by adding the scores of three components:
-
Data Quality Rule score
-
Service Request Score
-
Child Score.
Prior to calculating the Data Quality Score, it is necessary to calculate these three scores using the following formulas.
Data Quality Rule Score: (Passed Values / Total number of values) x Age Factor x Weightage, expressed as percentage.
Service Request Score: Σ (Open Service Requests in that period) x (Age Factor) x (- weightage of SR Score) / Total number of SRs, expressed as percentage.
Child Score: The Data Quality Score of the associated child objects. If no child objects are present then the weightage (25%) of the child score is added to the DQ rule score weightage (50%)
The Formula to calculate the Data Quality Score is illustrated below along with the corresponding default weightage:
-
If child objects are present: DQ Rule Score (50%) + Service Request Score (25%) + Child Score (25%)
-
If child objects are not present: DQ Rule Score (75%) + Service Request Score (25%)
Example
Object Type: Table
Number of Data Quality Rules Executed: 1
Data Quality Rule Executed Period: 35 days ago
Data Quality Rule Outcome: Failed
Total Values: 10
Number of Passed Values: 3
Number of Failed Values: 7
Number of Active Service Requests: 3
Service Requests Raised Period: One 13 days ago, one 47 days ago, one 93 days ago
Total Number of Service Requests: 10
Number of Child Objects: 5
Data Quality Rule Score Calculation
If the Data Quality rule score of the data object mentioned in the above example has to be calculated, then as the rule in totality is a failure and the statistics are available the failed and the passed values of the data object will be considered. So, the formula is (Passed Values (3) / Total number of values (10)) x Age Factor (0.9) x Weightage (0.5) = DQ Rules Score (13.5%)
Service Request Score Calculation
Example: Let's consider the data object in the above example.The formula that is used to calculate the Service Request score is as follows:
∑ Open Service Requests in that period x (Age Factor) (1x1 + 1x0.9 + 1x0.7)
x (- weightage of SR Score ) (-0.25) / Total number of SRs (10) = - 6.5%
Child Score Calculation
The Child Score is an average of the Data Quality Scores of all the associated child objects multiplied by the weightage allocated for Child Score.
Child Score = ∑ (Data Quality Scores of child objects) x Weightage for Child Score
To understand it better, let's take an example of 5 child objects with the Data Quality Scores 52, 62, 33, 95, and 88. The average score of these child objects is “66”. The default weightage of the Child Score is 25%. So, the child score in this scenario will be “16.”
The sum of the three scores mentioned above Data Quality Rule score, Service Request Score, and Child Score will be the Data Quality Score.
In this case, the Data Quality Score would be equal to: Data Quality Rule Score (13.5) + SR Score (-6.5) + Child Score (16) = 23.
Data Quality Dimension Score
Data Quality Dimension Score refers to the quality of data across various dimensions. It is used to evaluate the reliability, accuracy, completeness, consistency, and other aspects of data. The specific dimensions and criteria used to calculate the score can vary depending on the type of data being evaluated.

The dimension score is similar to the Data Quality score but it is calculated at the dimension level.
The formula to calculate the Dimension score is:
∑ (DQ Rule Score + Service Request Score + Child Score) for the given Dimension = Data Quality Dimension Score
Note: The Data Dimension Score only considers the Service Requests generated by the application while disregarding those initiated manually by the user (due to the fact that there is no way to associate the manually created service requests to a dimension).
Copyright © 2023, OvalEdge LLC, Peachtree Corners GA USA