- Knowledge Base
- Self Service
- Lineage Impact Analysis
-
News
-
Installation and System Setup
-
Setup Data Catalog
-
Connectors
-
Data Discovery
-
Self Service
-
Access Management
-
Data Quality
-
Data Literacy
-
Privacy Compliance
-
Reporting
-
Architecture, Security & Releases
-
Developer's Zone
-
Advanced Tools
-
Record of Processing Activities (ROPA)
-
Data Catalog
-
Release6.0 User Guide
-
Release6.1 Deep Dive Articles
-
Release6.1.1 Deep Dive Articles
-
Release6.2 Deep Dive Articles
-
Release6.3 Deep Dive Articles
View the Impact Analysis results
When the job executions are completed, the summary panel will be updated with the impact analysis summary data, and the affected objects status will change to SUCCESS.
A brief explanation of the summary panel data is given below:
| Field | Description |
|
Affected id |
Represents the id of the affected object which is always unique. |
|
Connection Name |
Represents the name of your connection which you gave in the Crawler page. |
|
System |
Represents the Schema name for your object. |
|
Object |
Represents the Name of The Table/Report/file (any objects). |
|
Object Type |
Represents the Type of the object like Table/Report/file, file columns). |
|
Analysis Type |
Represents different types like upstream/downstream/upstream with association/downstream with association. |
|
Job Status |
Represents Success/pending (represent the status like you run the object or not)/(if you run it will change the status from pending after the result it will show the success.) |
|
Job Run Date |
It will show the date when the job started. |
|
Impact Count |
Will give the count of how many objects are getting impacted for the object. |
|
Impact Level |
It represents at what level the impacted object is either upstream or downstream with reference to the selected object. |
|
No. of Downstream Objects |
It will represent how many objects have been added downstream and show the count for the same. |
|
No. of Upstream Objects |
It will show you the Number of objects you added from the upstream shows the count for it (from source side called as upstream). |
|
Downstream with Association |
It will give the count for the objects that have been added downstream with association (for destination for how many objects the query has been added). |
|
Upstream with Association |
It will give the count for how many objects query has been added from source side along with the tables in the lineage. |
|
Total Number of Impacted Objects |
It will give the total count for the number of all the impacted objects (upstream/ downstream/ upstream with association/ downstream with association). |

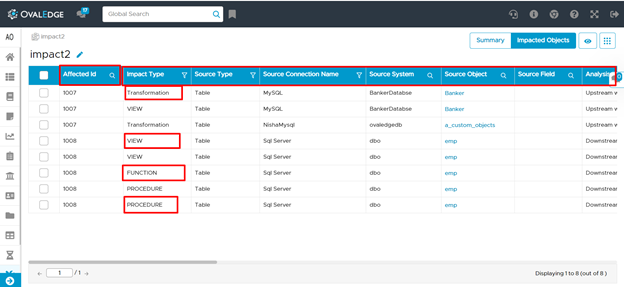
Users can apply various filter options available in the table columns to understand the impact objects data.
Please see this article Impacted Objects field list to know the list of all impacted objects, for the affected objects specified in the entry.