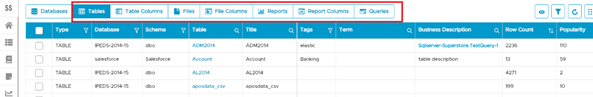
To view the lineage for an object (Table / Table column / Report / File / File column), select the object for viewing in the Data Catalog module.
Click on the Lineage tab (for tables, files, reports) or Column Lineage tab (for table columns, file columns) to view the lineage. This will display the lineage graph for the object if it has been built.
The graph includes all the source objects, target objects, datasets, and directly associated objects to provide a clutter-free view as the graph can quickly become complicated depending on the number of objects involved and the depth of lineage being shown.
The entity relationships inferred from the datasets and indirect associated objects can be viewed through the dataset view.
The screenshot below shows a sample lineage graph for a data catalog object.
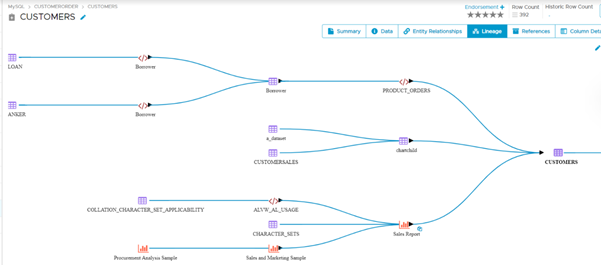
The depth of lineage to be displayed in the graph is a configurable value, that can be set by the system administrator.
Lineage Drilldown
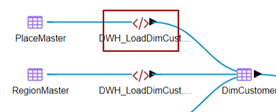
Clicking on the icons of data objects of Tables, Table Columns, Files, File columns, Reports, Report Columns will drill down into the lineage graph of that object. Users can see the lineage details of the upstream and downstream objects.
Lineage Drilldown: Dataset Lineage
One of the most used features of lineage graphs is a dataset lineage summary and understanding the transformation elements involved.
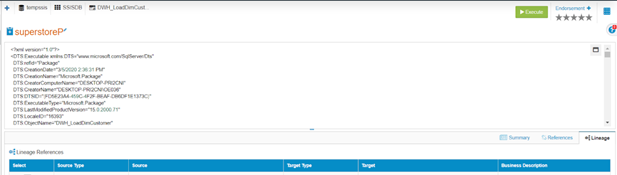
Click the dataset icon to view the dataset summary:
- The source code of the dataset, extracted from the source data system.
- Business description: This is an editable field.
- Summary: Data catalog details of the dataset object.
- Associations: The direct and indirect associated objects in the dataset.
- References: Entity referenced added by using through the business description.
- Lineage: The source, target lineage objects that are part of the dataset.
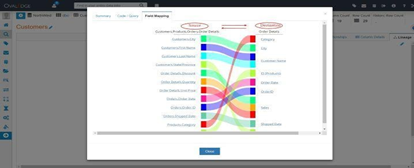
To view the column level mappings in the dataset, click on the connecting line from the dataset. This will display the following details:
- Summary: The description of the dataset lineage is shown and can be edited.
- Code / Query: This displays the source code of the dataset.
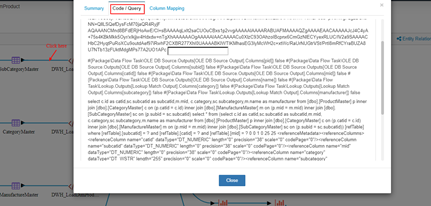
- Column mappings: This shows the column level data transformations involved in the dataset, in an interactive graph. Hovering over a column name shows the columns flowing into and out of the hovered column.