This report displays the total number of times each user has authored/updated business and technical descriptions of tables, and table columns. Additionally, it shows a count of glossary terms that the user has authored/updated with each table or column in the OvalEdge application.
Business description is being updated in two ways:
- Through data catalog : This allows users to enter the business description directly in the text area and also has the possibility to edit the description using the edit icon.
- Through business glossary - Copy Description : Enable this to copy the description of the term to the data object associated with the term.
In the screenshot below,
Bar chart illustrates the number of users who would have accessed and modified the business and technical description associated with objects( table or table columns).
In the reporting framework firstly, it provides a consolidated view of the list of users who have been accessing and modifying the business description / technical descriptions.
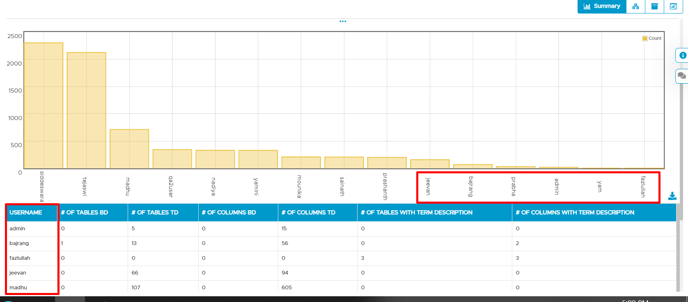
For example, reports shows the list of user names and its respective counts of tables or table column associated with business or technical descriptions
It is a simple task for a user to click on each bar chart. When the user clicks on any particular bar, the filter is activated. When the filter is active, output shows the name of the particular user associated with the list of Schema, table, column, and business description and technical description have been modified. Users also have the option to download the output result in the excel sheet. User can refresh the filter using reset filter.
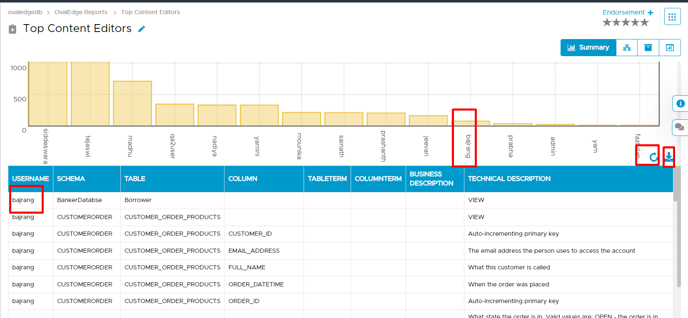
For example, it gives output of a particular user (Bajrang) details.