Tables are a collection of data structured in a table format with columns and rows within a schema of a database. When any connection (Ex: SQL) is crawled the Tables which are stored in the particular database connection are fetched and displayed in the Tables tab.
The Data Catalog Table search helps you perform a local search on all tables in the database to narrow down the search results and find Tables.
Users can search any type of data object using Data Catalog:
- Metadata like terms and tags to understand the data.
- Statistics of a data object (like min/max/null/distinct and top values).
- Using inbuilt algorithms to calculate hidden relationships between data sources.
- Understanding the Lineage.
- Adding References to a data set.
- Collaborating with the data experts.
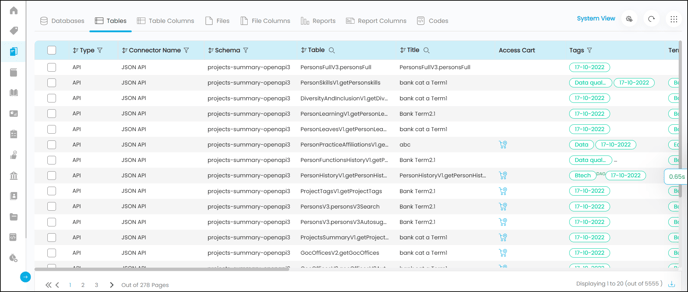
The Table tab displays the various table object’s metadata details, statistical details, and the actions that you can perform on Table(s).
|
Icons/Fields |
Description |
|
System View |
By default it displays the System View if no other views or created or selected. When you click on the System View button, the Views pop-up window is displayed with the list of views categorized into My View, System View, and Public Views. |
|
Configure View Icon |
The Configure View icon is enabled in the top right corner of the screen, which helps you to self-customize the columns that are visible on the Data Catalog table grid. When you click on the Configure View icon, the Configure View - System View pop-up window is displayed to add/remove column fields that should appear on the main page |
|
Refresh Icon |
Click on the Refresh icon to update the objects with the latest changes. |
|
Nine Dots Icon |
The Nine Dots icon is enabled in the top right corner of the page to perform multiple actions on the selected data object(s). |
|
Filter Icon |
Refine your search using the filter options. |
|
Search Icon |
Click on the search icon to search the specific data based on the keyword. Additionally, you can apply condition operators by clicking on the Eight Dots icon to search for the preferred option. |
|
Sort Icon |
Use the sorting icon to view the objects in alphabetical order from A-Z or Z-A. The multi-sorting feature helps sort more than one column at a time. |
|
Type |
Displays the different table types that include Table, View, API, or Materialized_View. |
|
Connector Name |
Displays the Connector Name associated with the Table. |
|
Schema |
Displays the Schema Name associated with the Table. |
|
Table |
Displays the Table's name, and when you click on the Table Name link, the Table Detailed page is displayed. |
|
Title |
Displays the Name of the Table. It is an editable field. Hover onto a specific title to see an edit icon in the Title Column. Click on the Edit icon to modify the existing title. The Title can also display the associated Term Title (if the Copy Title to data catalog option is selected from the detailed Term page). |
|
Tags |
Displays the Tags associated with the Table. The Tags field is editable, hover onto a specific tag field to see an edit icon. Click on the edit icon to edit and assign tags to the table. |
|
Term |
Displays the Term associated with the Table. The Terms field is editable, hover over a specific Term field to see an edit icon. Click on the edit icon to edit and assign or remove the Term to/from the table. |
|
Business Description |
Displays the Business Description - a clear understanding of the Table and its function. It is an editable field; hover onto a specific object Business Description field, and click on the edit icon to edit the Business description. Note: Users with Meta-write access can only edit the Business Descriptions. |
|
Technical Description |
Displays the technical parameters or comments defined at the data source. It is editable, hover onto a specific object Technical Description field and click on the edit icon to modify the existing technical description. |
|
Row Count |
Displays the total number of records existing in the Table. |
|
Column Count |
Displays the total number of columns existing in the Table. |
|
Popularity Score |
Displays the number of times the users interacted with this data object by viewing, endorsing, commenting, adding tags, or by querying the data object. The more the popularity score, the more the data asset gets popular for recommendations. |
|
Importance Score |
The score shows how vital this data object is across the organization on a scale from 0-100. |
|
Project |
Displays Projects associated with the Table. Hover on to a specific Table’s project field to see an Add to Project icon. Click on the icon to add the Table to the default or selected project. . |
|
Steward |
Displays the name of the steward. |
|
Custodian |
Displays the name of the custodian. |
|
Owner |
Displays the name of the owner. |
|
Certification |
Displays the type of Certification applied to the Table. The different Certification types are Certify / Caution / Violation / Inactive / None. |
Configure View
The Configure View icon helps self-customize the different data object attribute fields you wish to view on the Data Catalog objects page. The Configure View functionality helps self-customize the different data object attribute fields you wish to view on the Data Catalog objects page. The Data Catalog, by default, is set to display System View with predefined columns. You can create more Views to add/remove column fields that should appear in the Main page grid.
- Select a Connection from the drop-down list. Based on the selection, the relevant Global Additional Fields get displayed. There is a provision given to search the fields using the Search Fields. You can select the different field options listed under Quality, Dates, Connection, Additional Fields Governance, and Catalog.
- The selected field options are displayed in the Order Fields panel. You can click and drag the fields up/down to keep the priority fields at the top, which are accordingly displayed first in the Table main page grid.
- Update View: The System View cannot be updated. However, Views created by you can be edited and saved. Create New View: You can edit an existing view and give a new name to it using this option.
- Enter the Name of the View in the field provided. The Name of the view should be unique to save.
- Add a Description for the view in the field provided to give an idea about the created view for future reference.
- You can set the Page Size to any number from the drop-down options to view a specific number of objects per page.
- Set the view to Make as my Default to apply the created view as the default view.
- Set the view to Visible to all (Public View) to make the view visible to all the logged-in users.
- The fields with the
Wait icon display the impact on the performance of loading the fields.
Views
It displays the different types of Views listed below:
- System View: It is a system-generated view. The system view is applied by default if no other default view is created or selected. You cannot delete a system view.
- My View: It displays the views created by the logged-in user.
- Public View: It displays all the different Views created by other users in the application. You can select and apply the View you wish to see.
- To make a view your default view, select the Make as My Default option by clicking the Eight Dots icon provided for each type of view. Select the Delete option to delete the view. The System view cannot be edited.
User Actions
The following are the User Actions that can be performed on the Table using the Nine dots option
|
Actionable Items |
Description |
|
Add to my Watchlist |
It adds the selected Table to My Resources > My Watchlist page to get notified on significant metadata changes made to the Table. |
|
Remove from My Watchlist |
It removes the selected data objects(s) from the My Resources > My Watchlist window. It disables all the alerts. |
|
Add Tag |
It adds the Tags to the selected Table. |
|
Remove Tag |
It removes the Tags applied to the selected Table. |
|
Add Term |
It adds the Terms to the selected Table. |
|
Remove Term |
It removes the Terms applied to the selected Table. |
|
Add to Default Project / Add to My Access Cart |
It adds the selected Table to the default Project. The Add to My Access Cart option is displayed if the Default Project is set to My Access Cart Project. |
|
Service Desk |
To raise Request Access / Request Content Change service requests on the Table. |
|
Remove from Default Project |
It removes the selected Table from the default Project. |
|
Update Governance Roles |
It helps you to change or update the Owner/Custodian/Steward/Gov 4 / Gov 5/Gov 6 roles for the selected Table. |
|
Change Certification Type |
It helps to change the certification type for the selected Table. The data certification is a stamp of approval given to ensure the data is consistent, timely, and correct. It let you filter reports based on their certification status.
|
|
Add Tables to Impact Analysis |
It helps to see the impact of changes made to the Table on others data objects in the upstream or downstream. The Impacted objects can be viewed in Advanced Tools > Impact Analysis. |
|
Quick Tips |
It provides a few insights about the Table Objects. |
Search using Conditional Operators
The Condition operator options for the table plugin help refine the search results based on the selected condition operator.
|
Operator |
Detailed Instructions |
|
Contains |
To include the data objects in the search results containing the entered keyword. |
|
Doesn’t Contains |
To exclude data objects from the search results containing the entered keyword. |
|
Doesn’t Equal |
To exclude all data objects from the search results that don't contain the entire keyword entered. |
|
Empty |
To include the data objects in the search results that are empty. |
|
Ends With |
To include the data objects in the search results that end with the entered keyword. |
|
Equals |
To include the data objects that contain the search keyword. |
|
Is Not Empty |
To include the data objects in the search results that are empty. |
|
Starts With |
To include the data objects in the search results that start with the entered keyword. |
Different Access Control on Data
In the OvalEdge application the Superscripts are Color Coded in Orange.
|
Data Permissions |
Permissions |
|
No Access |
To restrict access to the data object. |
|
Preview |
Tables: Grants ability to view the Metadata and Data of a data object but cannot edit/Update. Lineage/Relationships: Grants ability to view the Lineage but cannot edit the Lineage manually. |
|
Read |
Databases/Tables: Grants ability to view Tables and download data, but cannot edit/Update. Lineage/Relationships: Grants ability to view the Lineage but cannot edit the Lineage manually. Files/Folders: Grants ability to view the Metadata details. Queries: Grants ability to view to access Query Sheets to run Queries. Users can perform only SELECT statements. Reports: Grants ability to view the Reports. |
|
Write |
To edit the data objects. Databases/ Tables: Grants ability to edit/Write/Update table contents using Query Sheet. Queries: Grants ability to execute and write queries to INSERT/UPDATE/DELETE data. Reports: Grants ability to create new reports using Query Sheets. Files/Folders: Grants ability to Add/Edit/Delete a File using Query Sheet. |
Access Control on Metadata
The Superscripts are color coded in Green.
|
Meta Permission Type |
Access Privileges |
|
READ ONLY |
Data Objects: Grants ability to view the metadata of the data objects (Tables/Files/Reports). Terms: Grants ability to view the existing Terms under a Domain. DAG: Grants ability to view the existing DAGs under a Domain. |
|
READ_WRITE |
Data Objects: Grants ability to view or edit the metadata of the data objects (Tables/Files/Reports). Term: Grants ability to Suggest a Term (Create new Term) /edit or delete the Term details/associate Terms to data objects. DAG: Grants ability to create new DAG Tags / can edit or delete the DAG details / can associate DAGS to data objects. |
Table Details
The Table detailed page displays the selected Table information where all the details pertaining to a particular table are exclusively displayed in the respective tabs mentioned below.
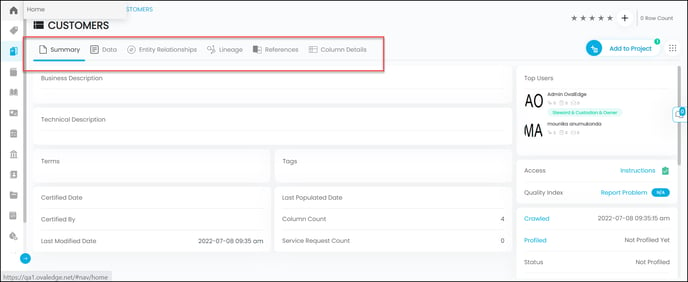
- Summary - The Summary tab displays all the meta-data information and statistical details of a specific Table. See more.
- Data - The Data tab displays the top 100 records (rows) of a Table in the grid upon crawling. See more.
- Entity Relationships - The Entity Relationship tab displays the complete logical relationship structure among Table and Table columns within a database based on Primary Key and Foreign Key relationships using Rectangles and connecting lines as links between them. See more.
- Lineage - The Lineage tab displays upstream and Downstream objects associated with a single Table object. Data Lineage is a visual representation that helps view the origin of the data, describes the path, and shows how it reaches the target and all the transformations it undergoes in its lifecycle. See more.
- References - The Table references tab displays a list of all references made to the Table from other data objects in the application. The benefit of having solid reference data is that you can confidently drill into subsets of your data to gain business insights. See more.
- Column Details - The Colum Details tab displays the list of Table Columns of the Table to selectively understand the statistics, relationships, and column-level lineage of each Table column. See more.
User Actions
The following actions are the possible user actions you can perform in the Table detailed page using the Nine dots icon.
|
Actionable Items |
Description |
|
Profile/Analyze |
You can Profile/analyze a table object to get statistical information such as row count, column count, max value, min value, null value, distinct count, and more. |
|
Process Upstream/Downstream objects |
The data objects that are certified as Caution objects can be applied to the associated downstream objects. Also, any applied Cautions can be removed from the associated downstream objects using this option. Additionally, you can choose to copy the metadata (Tags, Business Description, or Technical Description) to the associated Downstream or Upstream objects based on Lineage. The copy of metadata can be applied to all the levels or up to a defined level of the lineage. |
|
Add Table to Impact Analysis |
You can manually add the tables to see the impact of the Table on other objects (Upstream / Upstream with associations / Downstream / Downstream with associations in the application. The Impacted objects are displayed in the Advanced Tools > Impact Analysis |
|
Add Column to Impact Analysis |
You can manually add the tables to see the impact of the Table on other objects (Upstream / Upstream with associations / Downstream / Downstream with associations in the application. The Impacted objects are displayed in the Advanced Tools > Impact Analysis. |
|
Add/Remove to my watchlist |
You can add the selected data object to the My watchlist window to get regular notifications on any metadata and data changes. |
|
View in Query Sheet |
It navigates you to the Table -Query sheet. |
|
Service Desk |
|
|
Download |
You can download the Data, Descriptions, and Entity Relationships separately. |
|
Apply Certification |
Data Certification is giving a stamp of approval by ensuring the definitions and data are consistent, timely, and correct. It lets you filter reports based on their certification status.
|
|
Configure Search Keyword |
You can configure the searchable or relevant keywords added to the tables so that the end-users can search the content for which they are looking from the database more effectively. |
Summary
The Summary page displays all the metadata information and statistical details of a specific Table which includes descriptive information about the data such as Table Title, Business Description, Technical Description, Tags, Terms, Relationships, Transformations, Permissions, etc.
Metadata information for a data object is shown once crawling is done. However, Metadata doesn't show the data stored in the table columns or rows.
The statistical data fetches and displays the parameters only after profiling is done to the data object. The Row count, Column count, Null Density, Min value, and Max Value are a few statistical details displayed on the summary page.
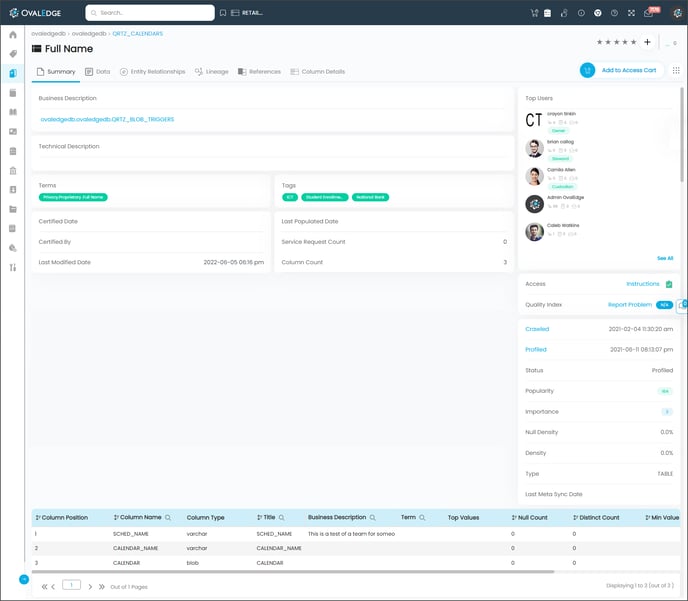 At the bottom of the page, the Table columns associated with Table are displayed with metadata and statistical details in a grid.
- Column Position - It displays the listing order of the column in a Table.
- Column Name - It displays the Column Name.
- Column Type - It displays the type of data a specific Table column holds such as Integer, Characters, Date, String, JSON, JSONB, array, float, and user-defined data types.
- Title - It displays the Name of the Table column. It is an editable field. Hover onto a specific title to see an edit icon. Click on the Edit icon to edit the title label. The Title can also display the associated Term Title (if the Copy Title to data catalog option is selected from the detailed Term page).
- Business Description - It displays the Business Description defined for the Table Column.
- Term - It displays the Term associated with the Table.
- Top Values - It displays the top 50 records (rows) of a Table column and also displays the count value based on how many times the record is repeated in the column. Click on the Top Values field, and the pop-up window with the Top Values and Count details is displayed.
- Null Count - It displays unknown values that represent a missing or blank field.
- Distinct Count - It displays the number of values that are unique (non-null) in a column.
- Min Value - It displays the minimum value from all the records in the Table Column.
- Max Value - It displays the maximum value from all the records in the Table Column.
- Profiled Status - It displays whether the Table column is profiled/unprofiled. If a column is profiled, a tick mark is displayed. If any columns have any errors or unsupported data types exist then a cross mark is displayed.
Data
Once crawling is performed , by default, the Data page displays the top 100 records (rows) of a Table . Here a Table can have hundreds or even more or less data records saved in the source. You can view all the data records using the Nine Dots > View in Query Sheet option.
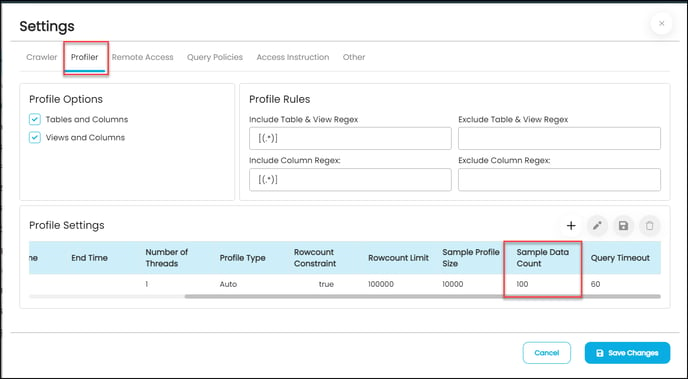
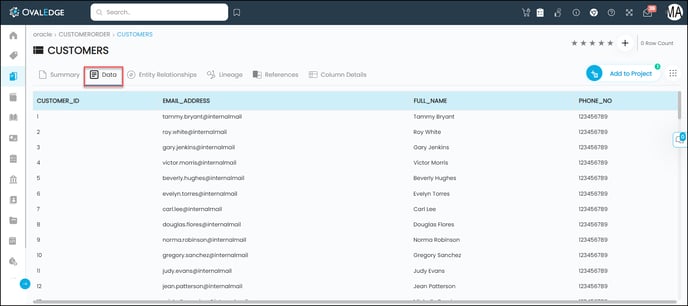 To fetch and view more Table Rows or records in the Data page, you can edit the profiler settings from Administration > Crawler > select Table connection > Profiler settings > sample data count to xxxx.
To view more data object records (rows):
- Go to Administration > Crawler.
- Select the Connection on which you wish to fetch data from the source, and click on the Nine Dots icon.
- Select the Settings option.
- In the Profiler > Profile settings grid > select the checkbox and click on the edit icon and change the Sample Data Count.
Entity Relationship
An Entity-relationship displays the complete logical relationship between a Table and other Tables in a database. Entity-Relationships are calculated based on Primary Key - Foreign Key relationships i.e. the tables with matching column data.
In OvalEdge, the Entity-Relationship diagram is displayed at Table level with clear detailing shown between a Table and other Tables Columns involved in the relationship using flowcharts i.e. Rectangles and connecting lines as links between them. The ER Diagrams of the table can be viewed in both the Graphical view and also Tabular View. If there are more than five relationships, then a tabular view is used to represent them. Relationships with fewer than five connections are shown in graphical view.
Importance of Entity Relationships
Some of the key advantages of using Entity Relationship are listed below:
- It displays the primary and foreign key relationships, if any exist.
- It helps to identify connections between tables and table columns that are logically related to each other.
- It helps to refine table structures, maintain data integrity, accuracy and minimize redundant data.
- It helps to analyze the database to find and resolve the problems in logic or deployment.
- Easy to implement security methods.
Building Relationships
Here is the list of different ways that help build Relationships in the application:
|
Relationships |
Algorithm Type |
|
Relationships defined at Source |
|
|
Crawler Settings > select Relationship checkbox |
PK-FK relationships captured from the remote server during the crawling stage. |
|
Advanced Jobs |
|
|
Discover Primary and Foreign key Relationships |
Primary Key & Foreign Key |
|
Discover relationships automatically |
Column Values - Match Count, Base Count, Unique Match Count. |
|
Get Relationships with Column Names |
Column Name |
|
Others |
|
|
Manually |
Adjusting relationships manually. Entity Relationships > Tabular View > Adjust Relationships & Calculate Relationships |
|
Query Parsing |
The Queries built using JOIN conditions are picked as relations. |
|
Pattern Relationships |
Using Pattern identifying algorithms and adding pattern relationships. |
Understanding Primary Key & Foreign Key
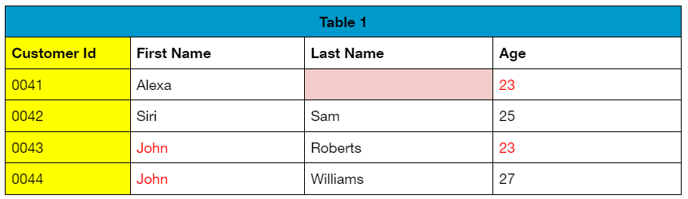
A Primary Key is a column in a Table that contains unique values for each row. You can think of the primary key as your Social Security number, which is unique and identifies you even if other people share your Name or Address.
A Table’s primary key must be unique and cannot be empty or null. To calculate Primary Key, Row count = Distinct count.
For Example, in the table below, the Customer Id has unique or distinct values without any duplicates or null values, while the First Name, Last Name, and Age columns have duplicate and null values. In fact, in this table Customer Id is the only column that could be used as the Primary Key.
Foreign Key
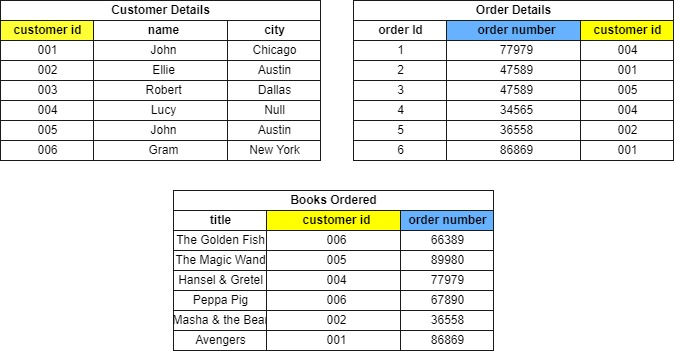
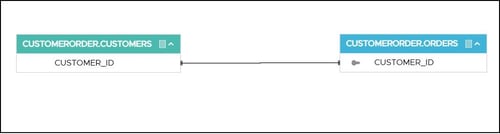
A Foreign Key is a column (or set of columns) in a table that has the same set of values as in the Primary key. It links and points to a column with the same data. Notice that the customer id column values in the Order Details table point to the customer id values in the Customer Details table.
- The customer id column in the Customer Details Table is the Primary Key.
- The customer Id column in the Order Details table is the Foreign Key.
- The customer id column in the Books Ordered tables is another Foreign key identified.
- The order number column in the Order Details table has references with the order number column in the Books Ordered table.
The Primary Key and Foreign key thus helps understand the relationships between Tables where the primary key is used as a reference or unique identifier to match Tables containing the same data. An entity (Table) can typically have just one primary key and several relationships with different foreign keys linked with different tables/columns in the database.
Calculating Relationships using Advanced Jobs
Discover Primary and Foreign key Relationships
Crawling retrieves the Primary Key, and Foreign Keys specified for the Tables at the source. For Tables that do not have any Primary or Foreign Keys specified, you can configure them using the Advanced job Discover Primary and Foreign key Relationships. This Advanced job examines real data and predicts Foreign and Primary key relations using the formula Row Count of a table/column = Distinct count of a table/column.
When a connection is profiled, the statistical details of the table are retrieved that includes the distinct count, minimum value, maximum value, null count, top 50 values, and others. To predict the Primary and Foreign Keys, the advanced job first calculates the Row count of the Table, and then the unique values are identified and computed.
For Example, as you can see in the table below, the row count of Table 1 is 6. The Distinct count for each column is now calculated. Distinct count calculates the number of different values stored in a given column. If not, consider duplicate or null (empty) values. Thus, a Primary key is identified. Using the Primary key as a reference or unique identifier, the matching values or data is identified in other tables and columns in the database. The Table column(s) that has matching data with the Primary Key values are represented as Foreign Key.
Discover relationships automatically
The Discover Relationships Automatically advanced job - to establish relationships it runs algorithms to find matching data or values in fields. It is independent of primary keys or foreign keys. A relationship is created if there is at least one value match between two table columns the Base and the Related table Column. The Base Match count, Related Match Count, and Unique Match Count scores are calculated using the advanced job.
Base Table: It is the table or column on which the Entity Relationship is calculated.
Related Table: It denotes a Table or column that has matching values with the Base table or column values.
Note: For the values 5,6,7,8,4,4,6 the result is 5 unique values - 4, 5,6,7,8. For the Values Bradley, Robert, Alen, Bradley, the result is two unique values - Bradley and Alen.
Base Match Count
A Base Match count score shows how closely related the two table columns are by matching the unique rows in the Base Table column with the unique values in the Related table column.
In the above example, only four records are matching out of six records in the Customer Details.customer id table column from Customer Details. Customer id table column. So, the Base Match score is 66.6
Related Match Count
A Related Match count score shows how closely related the two table columns are by matching the values of the Related Table column with the matching values in the Base table column, including the duplicate values.
In the above example, all the records of (customer id) in Order Details have matching records in Customer Details - customer id column. So 100% of records of Related Table Columns are matched.
Unique Match count
The unique match displays the count of unique values present in the Base and Related table columns.
- If the Percentage of the Unique matching count is 100%, it means all the rows or values in the Base Column have unique match values (with no duplicates or null values) with the Related Table column
- If the Percentage of the Unique matching count is 99%, it means 1% of the values in the Related Table have duplicate values.
Get Relationships with Column Names
Relationships are calculated based on the column names repeated in other tables. The column name of the Table, when matched with other Table column names in the database, a relationship is built.
Building Relationships Manually
In the Tabular View, there is an option enabled to build relationships manually. An +Adjust Relationships button is enabled to relate Tables or Tables columns to the current Table. To compute the scores, choose the Calculate Relationships option under the Nine Dots option. The scores demonstrate how closely related the Main table and the newly added table are to one another.
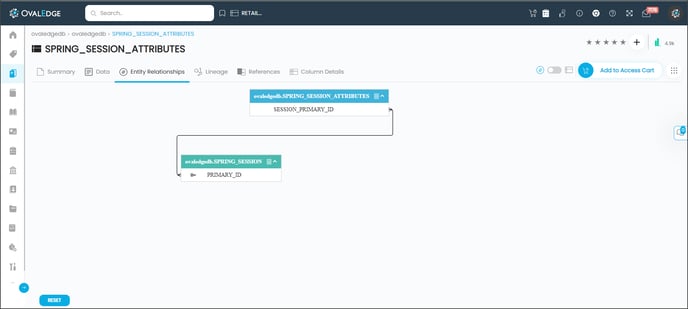
Understanding ER diagrams
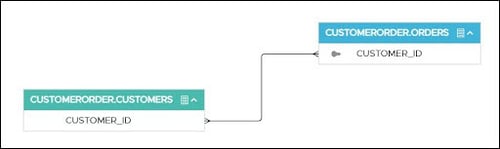
You can see the ER Diagrams of a Table by navigating to the Table detailed page and selecting the Entity Relationships tab. The ER Diagrams of the table can be viewed in the Graphical view. If there are more than five relationships, then a tabular view is used to represent them. Relationships with fewer than five connections are shown in a graphical view.
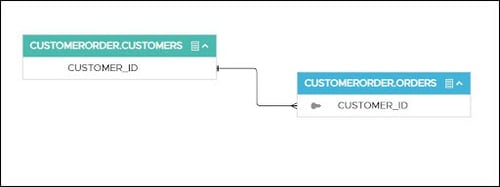
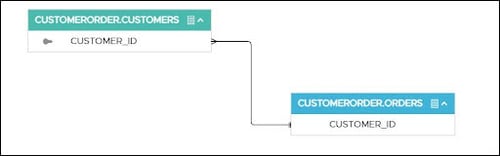
The Base or Main Table and its relations with other related or linked Table/Table columns are displayed in respective colored Table headers. The Table header shows the Table Name and table column name on which the relationship is built there is a column icon provided in the header to view the associated table columns in a separate window.
Base Table or Main Table
It is the table or column on which the Entity Relationship is calculated. It shows relationships with other tables/table columns in the database.
Related Table or Linked Object
It denotes a Table or column that has relationships with the Base table or main table. Each Table (Column) connected to the Base Table is called a Related Table or linked object.
- Additionally, the Primary Key or Foreign Key
associated with the Table columns is identified using the key icon.
- The lines display associations between Tables and Table columns. The symbols at either end of the line describe the relationship, whether one (double line) or many (crowfeet), between the Tables.
- The different Table Column Relationships that OvalEdge support are One-to-One, One-to-Many, Many-to-One, and Many-to-Many.
- Zoom in Zoom out: For more readability and visualizing, users can now zoom in and zoom out in the ER Diagrams.
- Dragging: users can now drag the tables left/right/top/bottom to have clear visuals of the Table relations.
Managing Table Column Relationships
Relationships help to combine data among different Table Columns. In OvalEdge, Relationships are calculated based on a connection between two tables that contain the same column information. The lines display association between tables and symbols at either end of the line describe the relationship whether one or many between the Tables. When there is a double vertical line at one end of the connector line it refers to one Table column and when there is a multi-line connector that looks like a crow foot
it refers to multiple Table columns relationships.
OvalEdge supports the below-mentioned relationships:
One-to-One: When information in one table also appears in the other Table connected. This is one of the most common relationships between tables.
One-to-Many: When more than one instance of this relationship type, a crow’s foot at the connector’s end represents Multiple or many links from one Table to other Table columns.
Many-to-One: When multiple table columns in a table also appear in one of the Table columns of the other Table connected.
Many-to-Many: When multiple table columns in a table also appear in multiple Table columns of the other Table connected.
Entity Relationship in Tabular View
The Tabular view displays the relationship information between the Base and Related Table objects. Base Table is the Table on which the relationships are built. Related Table is the Table / column which has a relationship with the Base Table.
|
Tabular details |
Description |
|
Base Connection Name |
Displays the Connection Name of the Base Table. |
|
Base Schema Name |
Displays the Schema Name of the Base Table. |
|
Base Table Name |
Displays the Table Name of the Base Table |
|
Base Column Name |
Displays the Column name of the Base Table on which the relationship is built. |
|
Base Table Row Count |
Displays the row count of the Base Table. |
|
Base Match Count |
A Base Match count score shows how closely related the two table columns are by matching the unique rows in the Base Table column with the unique values in the Related table column. |
|
Related Connection Name |
Displays the Connection Name of the Related Table. |
|
Related Schema Name |
Displays Schema Name of the Related Table. |
|
Related Table Name |
Displays Table Name of the Related Table. |
|
Related Column Name |
Displays the Column Name of the Related Table on which the relationship is built. |
|
Related Table Row Count |
Displays the row count of the Related Table. |
|
Related Match Count |
A Related Match count score shows how closely related the two table columns are by matching the values of the Related Table column with the matching values in the Base table column, including the duplicate values. |
|
Unique Match Count |
The unique match displays the count of unique values present in the Base and Related table columns.
|
|
Algorithm Type |
Displays the backend algorithm that built the relationship, whether Manual / Physical / Using Patterns / From Query. |
|
Query Name |
If we run any query -the cataloged query name is displayed. |
|
Delete Relationship |
Click on the Delete icon to delete the relationship and can view the changes in ER Diagram. |
Lineage
Data Lineage tracks the hierarchy or interrelation between objects. It helps to understand the origin of the data and describes the path - how it reaches the target and all the transformations it undergoes in its lifecycle. It provides the ability to track, understand, record, and visualize the dependencies and data transformation along with its path from source to destination. The Flowcharts help you track the flow from source to target or from target to source at multiple levels.
- Helps users make strategic decisions using accurate information and perform system migrations effectively.
- It helps automate data mapping
- It helps discover errors in data processes by validating the accuracy and consistency of the data.
- Analyze impacts on data objects.
- Showcases the dependencies at multiple levels.
- Perform root cause analysis on low-quality data.
In OvalEdge, lineage can be built in three ways:
- Manually: Manually, Source and Destination objects can be added to a data object (Table, File, Report) using the Advanced Tools > Lineage Maintenance.
- Build Auto-Lineage: To view end-to-end lineage, you can use the Advanced Tools > Auto-Build Lineage, where the Cataloged Queries or Source (for both Standard and Auto Lineage License types).
- Administration > Crawler > Nine Dots > Build Lineage (for Auto Lineage License type).
Auto Build Lineage
Lineage by Parsing is one of the most advanced lineage forms. It supports numerous tools and programming languages used to transform and process data, such as SQL, JAVA, XML, Jason, and more, to automate end-to-end data lineage.
The Auto build lineage and build lineage using the crawler settings are both automated processes where lineage is built for cataloged queries. The Cataloged queries are the queries that are fetched from remote or source while crawling and the queries that are executed in the OvalEdge application using the Query sheet.
Manual Lineage
Lineage Maintenance thus helps to manually add data objects to a Table, File, or Report to understand the data, view transformations, and drill down into the table, column, and query-level lineage.
For Example: An organization can have numerous reports which are used to make decisions for the long-term survival of the organization. However, to create these reports, several data sets may have been used. So, to find errors in any report, you can use the Lineage flowchart and trace the data set source of the error. You can visualize which reports are duplicates or reports that rely on obsolete or non-existent data.
Understanding Lineage Diagrams
This section provides details on building Lineage manually by adding Source or Destination objects and mapping columns to understand the data holistically. To view a lineage of a data object, navigate to Data Catalog > Tables > Select a table > Table detailed page > Lineage.
The following figure shows an example of a data lineage diagram.
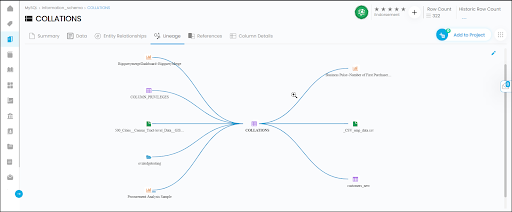
A lineage diagram illustrates the path of a single object’s data flow. In the lineage hierarchy, The data’s full lifecycle is shown using the associated source objects and destination objects.
Source Objects: The Source objects, also referred to as upstream objects, tell you where the data came from (upstream objects).
Destination objects: The Destination objects, also referred to as downstream objects, tell you where the data is flowing to (downstream objects).
Hovering on to a data object displays the data object details (database.schema.objectname). You can drill down deep into data assets by clicking on the node or thread (connector lines) to drill down more into the details and view Column Mappings and Query Codes. The below-mentioned details are displayed in a pop-up window.
- Summary: It is an editable field where you can add more information about the Lineage between them. Click on the edit icon to add descriptions about the lineage.
- Code / Query: It displays the responsible query extracted from the source system.
- Column Mapping: It displays the column mapping between the Source and Target if any mapped. (Refer to column-level lineage for more information). Hover on to a column name to view the Column Transformation Notes.
Editing Table-level lineage
In Manual Lineage, you can add / update / delete the Source or Destination (Target) objects associated with a data object. To manually build a lineage, an edit icon is enabled in the top right corner of the lineage page as per your preferences. Click on the edit icon, and you will be navigated to the Advanced Tools > Lineage Maintenance page.
- The Table details of the current table are, by default, displayed in the Object Type, Connection Name, Schema Name, and Table fields. You can select a Table using the fields.
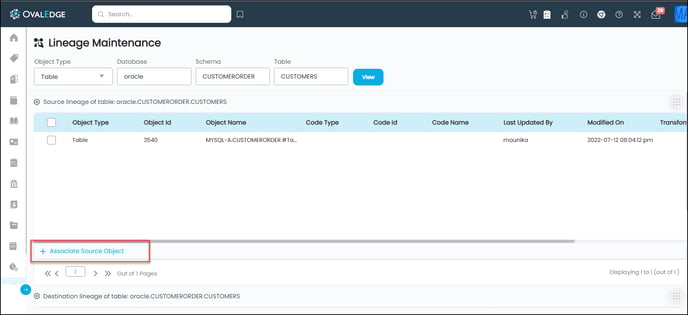
- Select a Data Object to add the respective object. Example: To add a Table to the Database / Schema / Table / Query, the respective text fields with dropdown suggestions are displayed. Upon selecting a data object, click the Save button, and the source object gets added.
- To add Destination objects, click on the Associate destination Object button enabled in the bottom left.
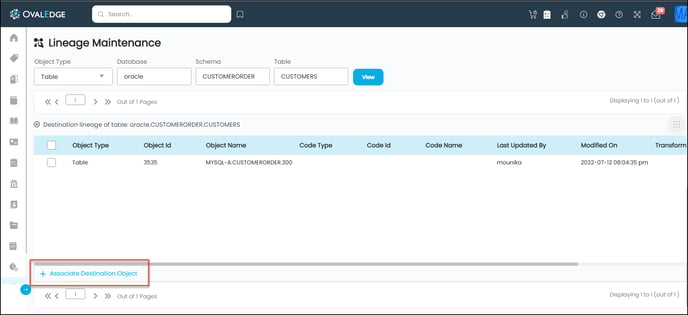
- Select a Data Object to add the respective object. Example: To add a File - the File System / File Name / Query, the respective text fields with dropdown suggestions are displayed. Upon selecting a data object, click the Save button, and the Destination object gets added.
- Thus, multiple Source and Destination objects can be added.
- Once the data objects are associated, click on the View button enabled in the top center to view the added source/destination objects in the lineage.
Mapping Columns
- Once the Source or Destination objects are added, click the edit icon under the Columns field to add the Column level details.
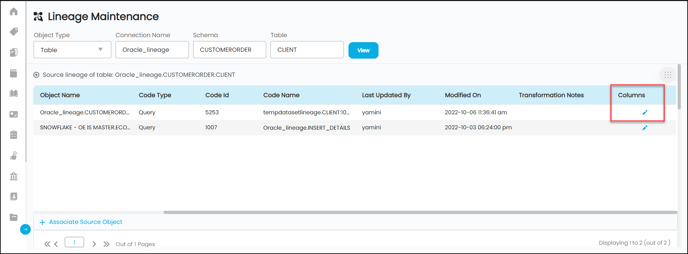
- You can set up column mappings in two ways:
- Using Map Column Via AI
- Manually mapping source columns to target columns.
-
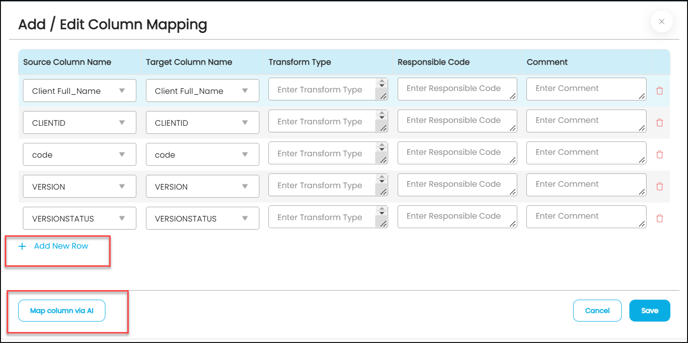
- Upon clicking on the edit icon, an Add / Edit Column Mapping pop-up opens with a Map Column Via AI button enabled at the bottom left corner.
- Click Map Column Via AI button to see all the column mappings between source and target.
- You can add Transformation notes, Responsible Code, and comments in the fields provided.
- Click Save to save the Column Mappings.
- A delete icon is provided to delete a column mapping that you don't wish to add.
- To view the column mapping, go to Object level lineage > click on the thread between source and target.
- A pop-up displays a summary, query code (if any added), and Column mapping.
- Select the Column mappings tab to view the mappings.
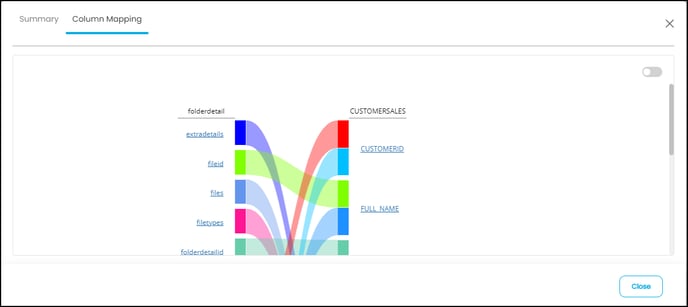
- To view the column mapping in Tabular view click the Toggle button enabled in the top right.
-
- Upon clicking on the edit icon, an Add / Edit Column Mapping pop-up opens with a +Add New Row link. Click the link to see a row added to the pop-up where you can add a source column from the Source name drop-down and Target column from the Target Name drop-down.
- You can add Transformation notes, Responsible Code, and comments in the fields provided.
- Click the Save button to save the Column Mappings.
- A delete icon is provided to delete a column mapping that you don't wish to add.
- To view the column mapping, go to Object level lineage > click on the thread between source and target.
- A pop displays with summary, query code (if any added), and Column mapping.
- Select the column mappings tab to view the mappings.
- To view the column mapping in Tabular view click the Toggle button enabled in the top right.
The added Source/destination objects can also be deleted using the Nine Dots icon enabled on the right of respective source/destination grids. Additionally, you can edit the Query and Transformation notes.
Note: The height, width, and other configurations pertaining to lineage can be set from Administration > Configuration > Lineage.
Editing Column Lineage
You can edit/add/remove the Source or Destination (Target) objects associated with a Column. An edit Column Lineage icon is enabled in the top right corner of the lineage page to edit the lineage as per your preferences. Click the Edit icon to navigate to the Advanced Tools > Maintenance page. The Source and Destination objects in here at the column level, can be viewed at the Table level.
- The data object details to which the source or destination objects are to be added is displayed at the top.
- The grid displays the existing associated source objects if any are added. To add source objects click on the Associate Source Object button enabled in the bottom left.
- Select a Data Object to add the respective object. Example: To add a Table to the Database / Schema / Table / Query the respective text fields with dropdown suggestions are displayed. Upon selecting a data object, click the Save button and the source object gets added.
- To add Destination objects click on the Associate destination Object button enabled in the bottom left.
- Select a Data Object to add the respective object. Example: To add a File - the File System / File Name / Query the respective text fields with dropdown suggestions are displayed. Upon selecting a data object, click the Save button and the Destination object gets added.
- Thus, multiple Source and Destination objects can be added.
- Once the data objects are associated, click on the View button enabled in the top center to view the added source/destination objects in the lineage.
Metadata Propagation Using Lineage
The purpose of this task is to add metadata information that include Tags, Business Description & Technical Description to a data object’s associated upstream or downstream objects.
Note: Users with the OE_ADMIN role can only edit the Lineage metadata propagation.
To add metadata to Dataobject lineage:
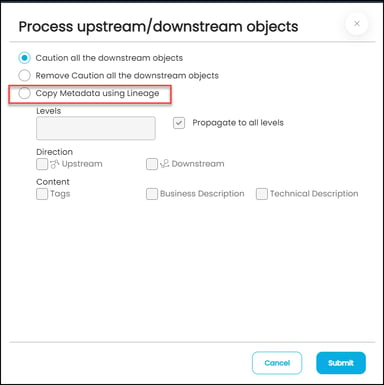
- Go to Data Catalog > select a data object > Object detailed pages> click on the Nine Dots icon > select Process Upstream / downstream objects option. A pop-up window with Copy Metadata using Lineage option is displayed.
- By default, propagation to all levels will be checked. Enter the Lineage Level number in the Lineage field provided to apply metadata up to a specific lineage level (level 1, level 2 or level 3).
- Select Propagate to all levels to apply metadata to the objects associated with the entire lineage.
- Select the Direction to apply Metadata to only Upstream objects or Downstream objects or both.
- You can choose to apply Tags, Business Description or Technical Description to the objects.
Lineage Versioning
Lineage versioning helps you to understand how the lineage of the data objects changes over time as the data system changes to support new business or technical requirements. This is supported for all the RDBMS connectors. Whenever a dataset is modified in the source system, a new lineage version for it is built in the OvalEdge platform and by default, the latest version is displayed. Lineage versioning is supported at a connection level and can be enabled/ disabled using the configuration settings.
To activate lineage versioning:
- Go to Administration > Configuration > set the value as ‘true’ for the key ‘add. dataset.lineage.version’ and add the connection id for the key ‘versioning.for.lineage.connection’ to display the ‘Version History’ and the ‘updated connection details (You can add multiple connection ids separated by comma(,))’ respectively.
- For the configuration ‘versioning.for.lineage.connection’, enter the connection Ids followed by a comma for the values, and then save.
Viewing Lineage Versioning
- On the Data Catalog > query > click on the updated query to view the query details. You will see the version history table with all the versions.
- Clicking on the Version History option displays the list of lineage versions available for the dataset. Selecting a version will set the lineage version as the selected version, and all the tabs displaying the information will be updated accordingly. (To get the lineage for the latest version, you need to rebuild the lineage using the Build lineage for selected queries to view the association, references, and lineage.
References
References provide a list of all references made to the Table from other data objects in the application. The benefit of having solid reference data is that you can confidently drill into subsets of your data to gain business insights.
References are made using the @ notation where the text field editor exists in the application. Business Description text field, Technical Description text field, Endorsement Rating text field, Projects - Notes, Term - Business Description field, Collaboration Message field, and Data Stories are some of the Text fields from which the references can be made.
References can be made to Business Glossary/Projects/Tables/Table Columns/ Files/File columns/ Reports/Report columns/ Data Stories/Queries.
The Table Reference page displays:
|
References Information |
Description |
|
Category |
Displays the Category of the reference. |
|
Reference From |
Displays the data asset to which the Table column is linked. |
|
Reference Object Type |
Displays the type of data object whether Business Glossary/Projects/Tables/Table Columns/ Files/File columns/ Reports/Report columns/ Data Stories/Queries/. |
|
Reference Object |
Displays the Data object Name. It is a clickable object link provided to navigate to the object detailed page from which the reference has been made. |
To create references to other data objects, you need a text field area.
Listed below are the text field areas in the application from where references can be made:
- Business Description field
- Technical Description field
- Endorsement rating
- Projects - Instructions,
- Term - Business Description field
- Collaboration Message field
- Data Stories
- In the Text field enter the @ notation to see a drop-down displaying the different data assets to which the Table can be referred.
- Select the data object or item you wish to refer to using the search filter drop-down options for which pertaining additional drop-down options are listed to select the object.
- Upon selection, the object gets referred to the Table.
- You can see the Table details in the referred objects > Reference Tab.
Columns Details
The Columns Details Page provides complete details of the columns included in the Table. The left panel shows the ordering of the Table columns. You can search the Table columns using the search icon and sort the columns using alphabetically A-Z, numerically 1-9, or sort by Importance or Popularity.
The Column Details detailed page is further divided into different sections:
- Column Summary: The metadata details and profiled statistical details of the Table Columns are displayed.
- Column Relationships - Relationships between tables tell you how much of the data is similar among the Table and Table Columns in the database. The relationship provides statistics to understand the strength and quality of the relationship.
- Pattern relationships - Pattern Relationship is one of the key aspects of a data catalog tool. It can help discover the relationship between data assets based on the pattern match algorithm. The pattern matching algorithm processes the data assets based on a data object pattern to find one or all the occurrences of a pattern. The Pattern Relationship works on both sample and fully profiled data sources within the schema.
- Column lineage - It displays lineage flow between a specific Table Column to other linked data object columns in the application. The Column Lineage is shown using the source objects and destination objects to drill down deep into data assets to view summary and query codes.
- Column References - Table references provide a list of all references made from a Table to other data objects in the application.
Copyright © 2019, OvalEdge LLC, Peachtree Corners GA USA