The Table Column detailed page navigates you to a specific Table Column of a Table > Column Details > Statistics page. The Table related information is displayed in the respective Summary, Data, Entity Relationships, Lineage, and References Tabs.
The Columns Details Page provides complete details of the columns included in the Table. The left panel shows the ordering of the Table columns. You can search the Table columns using the search icon and sort the columns using alphabetically A-Z, numerically 1-9, or sort by Importance or Popularity.
The Column Details detailed page is further divided into different sections:
- Column Statistics - The metadata details and profiled statistical details of the Table Columns are displayed.
- Column Relationships - It displays any relationships existing in the application based on the columns that contain the same data. Relationships between tables tell you how much of the data from a foreign key column can be seen in the related primary key column and vice versa. In OvalEdge, you can create, edit, and delete a column relationship manually.
- Pattern relationships - Pattern Relationship is one of the key aspects of a data catalog tool. It helps discover the relationship between data assets based on the pattern match algorithm. The pattern matching algorithm processes the data assets based on a data object pattern to find one or all the occurrences of a pattern. The Pattern Relationship works on both sample and fully profiled data sources within the schema.
- Column lineage - It displays lineage flow between a specific Table Column to other linked data object columns in the application. The Column Lineage is shown using the source objects and destination objects to drill down deep into data assets to view summary and query codes.
- Column References - Table references provide a list of all references made from a Table to other data objects in the application. The benefit of having solid reference data is that you can confidently drill into subsets of your data to gain business insights.
User Actions
The following actions are the possible actions you can perform in the Table Columns detailed page using the Nine dots icon.
|
User Actions |
Description |
|
Profile/Analyze |
Profile/analyze a table object to get statistical information such as row count, column count, max value, min value, null value, distinct count, and more. |
|
Calculate Relationships |
It helps to calculate relationships on column objects. |
|
Process Upstream/Downstream objects |
The data objects that are certified as Caution objects can be applied to the associated downstream objects. Also, any applied Cautions can be removed from the associated downstream objects using this option. Additionally, you can choose to copy the metadata (Tags, Business Description, or Technical Description) to the associated Downstream or Upstream objects based on Lineage. The copy metadata can be applied to all the levels or up to a defined level of the lineage. |
|
Add Column to Impact Analysis |
You can manually add the columns to see the impact of the Table on other objects (Upstream / Upstream with associations / Downstream / Downstream with associations in the application. The Impacted objects are displayed in the Advanced Tools > Impact Analysis.. |
|
Add/Remove to my watchlist |
Adds the selected data object to the My watchlist window to to get regular notifications on any metadata and data changes. Once removed the data object gets removed from My Watchlist and the notifications are disabled. |
|
View in Query Sheet |
Navigates you to the Table -Query sheet to view all the records of the Table and apply filters or functions to the records. |
|
Service desk |
|
|
Download |
You can download the Data, Descriptions, and Entity Relationships separately. |
|
Apply Certification |
Data Certification is giving a stamp of approval by ensuring the definitions and data are consistent, timely, and correct. It lets you filter reports based on their certification status.
|
|
Configure Search Keyword |
Configure Search Keywords are searchable or relevant keywords added to the objects for the end-users to search the content they are looking for from the database effectively. |
Column Summary
The metadata details and the profiled statistical details of the Table Columns are displayed. Select a specific Table column from the left panel to view the statistical details of the selected column in detail.
Profiling is the process of gathering statistics and informative summaries about the connected data source(s). Statistics can help in assessing the quality of the data source before using those as part of an analysis. When a profiling job is submitted on a data source, OvalEdge sends a query to the data source and computes the statistics from the raw data. These aggregated/calculated values are then brought back and stored in OvalEdge.
While OvalEdge does not store the entire data, the catalog on the other hand stores the computed results.
Column Relationships
It displays any relationships existing in the application based on the columns that contain the same data. The relationships added at the column level can be displayed at the Table level.
|
Relationships Grid Details |
Description |
|
Connection Name |
Displays the Connection Name to which the Table Column belongs. |
|
Schema |
Displays the Schema name the Table Column belongs to. |
|
Table |
Displays the Table to which the Table Column belongs to. |
|
Column |
Displays the name of the Table Column. |
|
Row Count |
Displays the number of rows in the table column. |
|
Null Count |
Displays the count of null values present in the Table column. |
|
Matching Count |
The unique match displays the count of unique values present in the Base and Related table columns.
|
|
Unique Matching Count |
The unique match displays the count of unique values present in the Base and Related table columns.
|
|
Base Match Count |
A Base Match count score shows how closely related the two table columns are by matching the unique rows in the Base Table column with the unique values in the Related table column. |
|
Medium |
It denotes how the column relationship is created.
|
|
Status |
The status of the column relationship is based on how the table columns are profiled.
|
|
Relation Score |
Relationship score is a recommended score that displays the correlation strength that exists between two compared columns. |
|
Relation Type |
This displays the different types of relationships that exist between two entities. 1-1,1-N, N-1, N-N, and UNDEF (when profiling is not done).
|
|
Show in ER Diagram |
Displays the relations built using ER Diagram. |
Adding Column Relationships
- Go to the Data catalog module >select a table > Table detailed page > Column Details > Relationships > select a Table column from the left panel.
- Click on the Adjust relationship button to add the new object for which the Relationship Score, Matching Count, and other scores are calculated and displayed in the respective fields.
Edit Column Relationship
To create a relationship,
- Go to the Data catalog module >select a table > Table detailed page > Column Details > Relationships > select a Table column from the left panel.
- Click on the Adjust relationship button to add the new object.
- Select the Database, Schema, Table, and Column name of the secondary table to create a new relationship to the base table.
- Click Done and the New Relationship is created and the Relationship Score, Matching Count, and other scores are calculated and displayed in the respective fields.
Deleting a Relationship
Relationships grid displays the default or defined relationships. Select a relationship(s) from the grid, and click the Options button to select the Delete Relationship option. The Relationships get deleted.
Calculating the Relationship
The strength of the relations between the primary(Base) and secondary(Related) columns can be calculated in two ways.
- You can select the Calculate relationships using the nine dots options to calculate the value for all the Table column mappings all at once.
- You can also select and calculate the relationship for a single row by clicking the Options button to select the Calculate Relationships option.
- A job is submitted to automatically calculate the relationships between the columns of the selected data object.
- Navigate to the column Relationship grid to understand the statistics between the new relation table.
Show/hide ER diagrams for Column Relationships
Relationships grid displays the default or defined relationships. Select a relationship(s) from the grid, and click the Options button to select the Show in ER Diagram option to view the column Relationship represented in ER Diagram view.
Pattern Relationship
Pattern Relationships help you discover the relationship between data assets based on the patterns in the data. In OvalEdge, the pattern-matching algorithm processes the data assets to find one or all the occurrences of a pattern using the Uppercase, Lowercase, or numerals in the data.
It uses Pattern criteria listed below:
- Displays Numeric pattern relations using the letter “D”
- Displays Uppercase pattern relations using the letter “U”
- Displays Lowercase pattern relations using the letter “L”
For Example: A column named Credit Card number might have a 16-digit pattern as DDDD-DDDD-DDDD-DDDD. The Pattern for an email Id Ovaledge123@ovaledge.com is changed to ULLLLLLLDDD@LLLLLLLL.LLL.Whenever a similar pattern match is identified, the pattern Match score is computed and displayed. If the Pattern match score is higher, it means more data patterns are matching between the compared data objects, and better will be chance of correlation.
You can add the identified pattern relations to the Column relationship and calculate the correlation between them. The patterns added gets reflected in the Entity-Relationships.
Note: To generate the Pattern relationship, the objects listed should be minimum sample profiled.
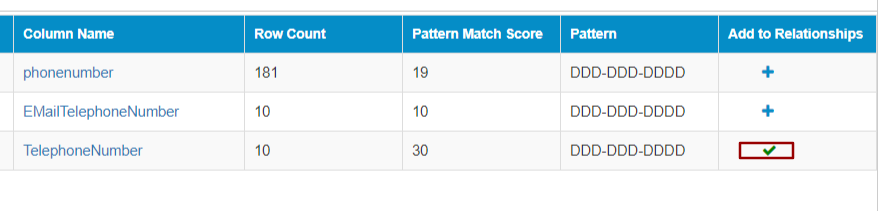
The Pattern Relationships built are displayed in the grid. Click on the +icon, and the Relationships get added to the Relationships tab.
|
Pattern Relationships Grid |
Description |
|
Connection |
Displays the connection name of the object. |
|
Schema |
Displays the Schema Name of the object. |
|
Row Count |
Displays the Row count of the Table. |
|
Table Name |
Displays the Table Name of the Table. |
|
Column Name |
Displays the Column name. |
|
Pattern Match Score |
Pattern Match Score provides the strength of the pattern relationship between Column A and Column B. As higher the pattern match score stronger is the pattern relationship between two columns. |
|
Pattern |
Numeric patterns with “D” Uppercase letters with “U” Lowercase letters with “L” |
|
Add to Relationships |
To add a column to the relationship tab, select an object, and click the |
Adding Pattern Relationships
The Pattern Relationships built are displayed in the grid with the Object details - Schema/Table/Column Name, Pattern Match Score, Pattern, and an Add to Relationships + icon. Based on the Pattern Match Score, you can add the object to the relationships.
- To add a column to the relationship tab, select an object, and click the
icon. The selected object is added to the relationship tab.
Deleting the Added Patterns
To delete the added patterns from the Relationship tab,
- Go to the Data Catalog > Table Columns > select Table column > Relationships tab.
- Select the Relationship from the grid.
- Click the Options button to see the Delete Relationship option.
- Select the Delete Relationship option to delete the relationship.
Example: A column named credit card number might have a pattern as DDDD-DDDD-DDDD as well as DDDD-DDD-DDDD.
Whenever a similar pattern match is reported, the object is listed and the pattern Match score is computed and displayed. The pattern match score is a percentage score between 0-100 that calculates the similarity between two table-column values. The scores are calculated as a weighted average of top 50 values.
If the Pattern match score is higher, it means more data patterns are matching between the compared data objects and better will be the chance of correlation.
You can further add these patterns to the Column relationship and calculate the correlation between them. The correlation between the objects can help you understand the strength of the relation between the compared data objects. The patterns added also get reflected in the Entity-Relationship tab as both graphical and tabular views. However, the number of objects that are graphically displayed is limited to 5 in the backend.
Adding Pattern Relationships
The Pattern Relationships built are displayed in the grid with the Object details - Schema/Table/Column Name, Pattern Match Score, Pattern and an Add to Relationships + icon. Based on the Pattern Match Score you can add the object to the relationships.
- To add a column to the relationship tab, select an object, and click the
icon. The selected object is added to the relationship tab.
Deleting the Added Patterns
To delete the added patterns from the Relationship tab,
- Go to the Data Catalog > Table Columns > select Table column > Relationships tab.
- Select the Relationship from the grid.
- Click the Options button to see the Delete Relationship option.
- Select the Delete Relationship option to delete the relationship.
Column Lineage
It displays lineage flow between a specific Table Column to linked data object columns in the application. The Column Lineage is shown using the source objects and destination objects to drill down deep into data assets to view summary and query codes. Click on a thread (the connecting line between source and target) a pop-up window is displayed with the below-mentioned elements:
- Summary: The Lineage description of the dataset is displayed. It is an editable field. Click the edit icon to add descriptions about the lineage.
- Code / Query: Displays the responsible query extracted from the source system.
Editing Column Lineage,
You can edit/add/remove the Source or Destination (Target) objects to a Table Column. An edit icon is enabled in the top right corner of the lineage page to edit the lineage as per your preferences. Clicking upon the edit icon you will be navigated to the Advanced Tools > Maintenance page.
- The data object details to which the source or destination lineage is to be added are displayed at the top.
- The grid displays the associated source objects (if any exist) with the Associate Source Object button enabled in the bottom left of the source lineage field to add the object to the Source objects. Click the Associate Source Object button to add select the object type from the drop-down to which respective fields are displayed to select a data object. Upon selection, click the Save button to see the associations added to the lineage.
- The grid displays the associated destination objects with the Associate Destination Object button enabled in the bottom left of the destination lineage field to add the object to the destination objects. Click the Associate Destination Object button to add the select the object type from the drop-down to which respective fields are displayed to select a data object. Upon selection, click the Save button to see the associations added to the lineage.
- Once the Source or Destination objects are added, you can select to edit or add the Column details from the grid. Click the Map Column Via AI button to add all columns automatically or select desired columns manually using the +icon against the column.
- Once the data objects are associated, click the View button enabled in the top center to view the added source/destination objects in the lineage.
- The added Source/destination objects can also be deleted using the Nine Dots icon enabled on the right of respective source/destination grids. Additionally, you can edit the Query and Transformation notes.
Similar to the table lineage you can also view the flow of a specific Table column to other data object columns in the application. Click on a thread (the connecting line between source and target) a pop-up window is displayed with Summary and Code/Query details.
Column References
Reference objects contain a specific set of information to be used by other data objects in the application.
Column references provide a list of all references made from a Table to other data objects in the application that include Business Glossary/Projects/Tables/Table Columns/ Files/File columns/ Reports/Report columns/ Data Stories/Queries/.
Objects can be referenced or linked to other data assets using the @ notation where the text field editor exists in the application. Business Description text box, and endorsement rating text box are a few text fields from which the data objects can be referred.
|
References grid details |
Description |
|
Category |
Displays the Category of the reference. |
|
Reference From |
Displays the data asset to which the Table column is linked. |
|
Reference Object Type |
Displays the type of data object whether Business Glossary/Projects/Tables/Table Columns/ Files/File columns/ Reports/Report columns/ Data Stories/Queries/. |
|
Reference Object |
Displays the Data object Name. |
To create references to data objects,
- In the Text field,enter the @ notation to see a drop-down displaying the different data assets to which the Table can be referred.
- Select the data asset using the search filter drop-down options.
- In the following example, a reference is created from the Business Description text field to Tables > Sqlserver.production.bonus.
- Navigate to the References tab of Sqlserver.production.bonus Table detailed page to see Product Assembly in the references list.
Copyright © 2019, OvalEdge LLC, Peachtree Corners GA USA