In OvalEdge, users can share any or all of the executed queries with any user by simply saving the queries. All the saved queries are cataloged and displayed in the Query Interface tab.
This window is accessible from:
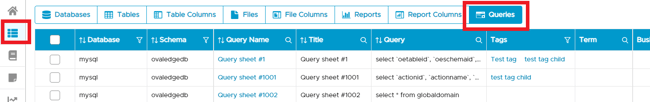
- Data catalog → Queries tab in the object browser
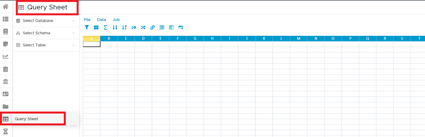
- Can be directly launched by accessing the cataloged queries in the Query sheet module.
The query interface window allows users to perform additional operations on a cataloged query. Users can further enhance and save the query to get results.
Execute the Shared Query
In this example, we will see how to execute a cataloged Query,
Go to the Data Catalog → Queries and use the filters to select a specific query.
Edit the query. Click the nine dots and select the Save button to save it. Click the Execute button to run the query. The results of the query will be visible in the results window.
Visualizing the Query Results
The data results can be visualized graphically in this window.
Prior to visualizing the query results,
- Build and execute a query.
- The query must be cataloged(saved).
To build a visual from a cataloged Query,
Select the Query from the Data catalog-->Query tab. This will take you to the Query interface
Make changes to the query if any and click Execute to execute the query and see the results in the result window. Click the Visualize results tab to select from the available charts in OvalEdge. Choose a chart to represent your data in the x and y-axis. Select the corresponding columns to visualize the results.Publish the Visual
Once the Query results are viewed in a graphical way, click publish to share and view the results in the All Reports Dashboard.
- Click the Publish button. A pop-up window allows the user to input the chart details.
Enter a report name, and report description (it allows users to get more detail about the chart). Select the Reports group from the drop-down list.
If there is no report group listed, create a report group using the Administration>> Security>> Report group tab or reach your administrator.
The Reports group is a user-defined group name where the selected report must be published.
Click Publish report. Navigate to the timeline dashboard to view the published chart.