When any report connection (Ex: Looker, PowerBi, Microstrategy) is crawled, the report Columns available in a particular database connection are fetched and displayed in the report Columns tab.
Note: You need to enable the Report column check box in the crawler setting page to get the report columns.
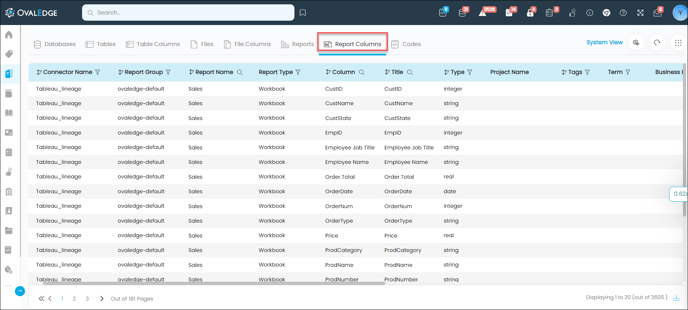
You can go to the Reports via Data Catalog > Report Columns.
You can click on the below-mentioned icons available on the Report Columns Main page to get the detailed information regarding the various objects.
|
Icons/Fields |
Description |
|
|
The System View is the system-defined View displaying a specific set of defined column fields in the grid. Click on the System view to see a list of all three Views - My View (created by you), System View, and Public View (views created by other users). The application displays the System View by default if no other views or created or selected. |
|
|
The Configure View icon provided in the top right corner helps you to customize the layout of the screen to view the information as per their requirement. By default, the display of the data is set to System View with predefined columns. To view particular columns, which are not included in the system view, you can add those required columns in the layout using the customize plugin option. |
|
|
The function of the Reset icon is to clear all the filters applied on the Report Column page. |
|
|
The Nine dots icon enabled in the top right helps you perform multiple actions to the selected data objects. |
|
|
Apply filters to view selected options related to search results. Click on the search filter to search results based on entered keyword. Also, by clicking upon the search icon, you can apply condition operators by clicking on the Use the sorting icon to display results alphabetically from A-Z / Z-A. |
|
Connector Name |
Displays all the databases available in the OvalEdge application, containing the reports. |
|
Report Group |
The Report group is simply a group of Reports. Multiple Charts and dashboards can be grouped under a single Reports group to easily manage its security permissions. |
|
Report Name |
Displays the report column name, which is defined at the source. You can’t edit the Report Name. Note: An eye icon is available in the Report Name column to provide a quick view of the report. |
|
Report Type |
Displays the report category such as workbook, clustered bar chart, TableEx etc. |
|
Column |
Displays the column names available under a Report. Note: An eye icon is available in the column name column to provide a quick view of the report. |
|
Title |
Displays the name or title of the Report Column. The title is an editable field. Hover over a specific title to see an edit icon in the Title Column. Click the Edit icon to edit and click the Save button to save. |
|
Type |
Displays the type of reports such as Bar chart, Tile, Dashboard etc. |
|
Project Name/ Access Cart |
If My access cart is selected as the default project, then the label name will be will be changed from Project to Access Cart, and you can raise an access request using the access cart icon. |
|
Tags |
Display the Tags associated with the Report. The Tags field is editable; hover over a specific tag field to see an edit icon. Click the edit icon to edit and assign tags to the object. |
|
Terms |
Display the Term associated with the Report. The Terms field is editable; hover over a specific tag field to see an edit icon. Click the edit icon to edit and assign or remove tags to the object. |
|
Business Description |
Displays details on what data the report holds. It is editable; hover over a specific object, Business Description field, and click on the edit icon to edit the description. |
|
Technical Description |
Displays the technical parameters or comments defined at the data source. It is editable; hover over a specific object Technical Description field and click on the edit icon to edit the description. |
|
Created by |
Displays the user who has crawled the Database. |
|
Path |
Displays the location of the report on the source. |
|
Popularity |
The total number of view counts is displayed to show how popular the data asset is relative to other assets in the application. |
|
Importance |
The score shows how vital this data object is across the organization on a scale from 0-100. |
|
Project |
The project associated with the data object is displayed in this column. |
|
Owner |
Displays the name of the Owner. |
|
Steward |
Displays the name of the Steward. |
|
Custodian |
Displays the name of the Custodian. |
|
Certification |
Displays the Certification applied to the object whether Certify / Caution / Violation / Inactive / None. |
When you click on the Report Column, it will redirect you to the Report Column detailed page. The report column detailed page is further divided into Report Statistics, Report Lineage, and Report Reference page.

User Actions on Report Columns
The following are the User Actions that can be performed on the Report Columns using the Nine dots option
|
Field |
Description |
|---|---|
|
Add Tag |
Tags can be added to one/ more data objects by using this feature. |
|
Remove Tag |
Tags added to single/ multiple data objects can be removed by using this feature. |
|
Add Term |
Terms can be added to single/ multiple data objects by using this feature. |
|
Remove Term |
The Terms added to single/ multiple data objects can be removed by using this feature. |
|
Add to Default project |
The selected data object can be associated with the default project by using this feature. |
|
Remove from Default project |
The associated default project can be removed from the data objects by using this feature. |
|
Update Governance Roles |
Governance roles such as Steward, Custodian, and Owner can be added to the selected data objects by using this Nine dots feature. |
|
Add Reports to impact analysis |
Impact Analysis involves analyzing and tracing the impact of data changes on the data in the source system. It tracks the data elements that is impacted, both upstream and downstream to the source data objects. You can manually add the reports to see the impact of these objects. |
|
Quick Tips |
It gives a few insights on the Reports objects. |
Add a report column
The report column allows you to add a column to the report.
To add a report column:
- Navigate to Data Catalog > Reports > Column Details Page.
- Click on the + icon, which will display Add Column Pop-up.
- Enter the column name in the required field.
- Click on the Add column, to add the column.
Note: A search bar is available on the report column to search the required report columns.
Column Summary
The Report column statistics provide the statistical details of the Report Columns. Select a specific Report column from the left panel to view the statistical details of the selected column.

Tasks performed on Report Column Summary:
The following are the User Actions that can be performed on the Report Columns Summary using the Nine dots option
|
Icons/Fields |
Description |
|
Process upstream/ downstream objects |
This option helps to certify the downstream data objects as a caution, remove caution from the downstream, and to copy the metadata of the upstream/downstream objects of the select Report. |
|
Add to my watchlist |
You can add the Report to my watchlist using this option. |
|
Send messages |
This option helps to send messages to the owner, steward, and top users of the downstream data objects of the report column. Note: The send message option will be enabled in case of the availability of the downstream objects for the report column. |
|
Service Desk |
You can add tickets to ServiceDesk using this feature. |
|
Add to Impact Analysis |
You can add this data object to impact analysis using this feature. |
|
Apply Certification |
You can certify the reports by using this Nine dots feature. |
|
Add to Favorites |
You can add the report to the favorite page, using this option and you can see it on the Dashboard > Favorite Reports page. |
|
Configure Search Keywords |
You can configure keywords to search the data object. |
Column Lineage
It displays lineage flow between a specific Report Column to linked data object columns in the application. The Column Lineage is shown using the source objects and destination objects to drill down deep into data assets to view summary and query codes.
Click on a thread (the connecting line between source and target) to see a pop-up opening on the screen displaying the below-mentioned elements.
- Summary: The Lineage description of the dataset is displayed. It is an editable field. Click the edit icon to add descriptions about the lineage.
- Code / Query: Displays the responsible query extracted from the source system.

An edit icon is available on the column summary, which navigates to the lineage maintenance. The lineage maintenance allows to add source and destination association objects manually to the report column.
Column Reference
References provide a list of all references made to the Table from other data objects in the application. The grid displays the Category/ Reference From/Reference Object type/ Reference Object details.
References can be using the @ notation where the text field editor exists in the application. Business Description text field, Technical Description text field, Endorsement Rating text field, Projects - Notes, Term - Business Description field, Collaboration Message field, and Data Stories are some of the Text fields from which the references can be made.
References can be made to Business Glossary/Projects/Tables/Table Columns/ Files/File columns/ Reports/Report columns/ Data Stories/Queries/.
To create references to other data objects from a Table, you need a text field like Business description, Technical Description field, or endorsement rating to refer to the objects.
- In the Text field, enter the @ notation to see a drop-down displaying the different data assets to which the Table can be referred.
- Select the data object or item you wish to refer to using the search filter drop-down options for which additional drop-down options are listed to select the object.
- Upon selection, the objects get referred to the Table.
- You can see the Table details in the referred objects > Reference.

Copyright © 2019, OvalEdge LLC, Peachtree Corners GA USA