Welcome View 
The Highlighting features onboard the users to the OvalEdge and guides users to get started with the application.
End-to-End Data Governance
- Data Access: Navigates you to the Security.
- Data Quality: Navigates you to the Data Quality Dashboard
- Business Glossary: Navigates you to the Business Glossary.
- Data Stories: Navigates you to the Data Stories.
Self Service Tools
- Impact Analysis - Crawl the various data sources and build the lineage to find the impact or dependencies of a data object on other assets in the application.
- Lineage Maintenance - Track data from its origin to its destination and even identify errors created along the way.
- Service Desk - It serves as an interface between the application users and the business owners to communicate, collaborate and handle a variety of requests to keep operations running smoothly
- Load Metadata from Files - Using Files, metadata for the objects can be downloaded, uploaded and imported (updated).
- Data Classification - Data Classification plays a critical part in information security and compliance programs (HIPPA or GDPR) to enable controlled access to sensitive data (PII) or most critical assets with the help of classified Terms.
- Query Sheet - It is a way to process data without having coding knowledge. It helps set filters and conditions for the data you want to get.
Data Catalog
OvalEdge automatically organizes and catalogs your data using machine learning and advanced algorithms. You can organize data using tags, usage statistics, user names, and other markers – so it’s easily retrievable with everyday language.
- APIs
- Tables
- Files
- Reports
Home Page Elements
The home page enhances accessibility to the most commonly used application features relevant to the logged-in user. The Home Page interface is divided into different sections with accordions to collapse/expand sections for a clutter-free interface.
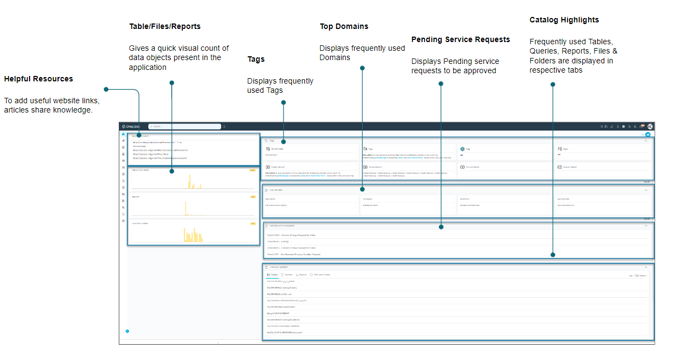
Helpful Resources
It is an editable field where users can add information as references. It helps to save information that may include recommended websites, blogs, resources, links, articles, or any other information to share Tribal knowledge and provide value to the users.
Tables & Views
It displays the total number of Tables and Views present in the application. The graph displays a quick visual count of Tables and Views for all the connectors - where a specific bar represents a connector, displaying the total number of Tables and Views it contains.
Reports
It displays the total number of Reports present in the application. The graph displays a quick visual count of Reports for all the connectors - where a specific bar represents a connector, displaying the total number of Reports it contains.
Files & Folders
It displays the total number of Files and Folders present in the application. The graph displays a quick visual count of Files and Folders for all the connectors - where a specific bar represents a connector, displaying the total number of Files and Folders it contains.
Tags
The most frequently used Tags and recently added Parent or Root tags are displayed along with the Tag Description. Clicking on a selected Tag icon navigates you to the Tag details page.
Domains
The most frequently used Domains and recently added Domains are displayed along with the Domain Description. Clicking on a selected Tag icon navigates you to the Tag details page.
Pending Service Requests
It displays the pending service requests pending to be approved by the logged-in user are listed. Clicking upon a service ticket, you will be navigated to the Approval Desk.
Catalog Highlights
The most frequently used and newly added Tables, Queries, Reports, Files & Folders are displayed in respective tabs. A toggle is enabled to view Top or Recent Catalogs.
Copyright © 2019, OvalEdge LLC, Peachtree Corners GA USA