Overview
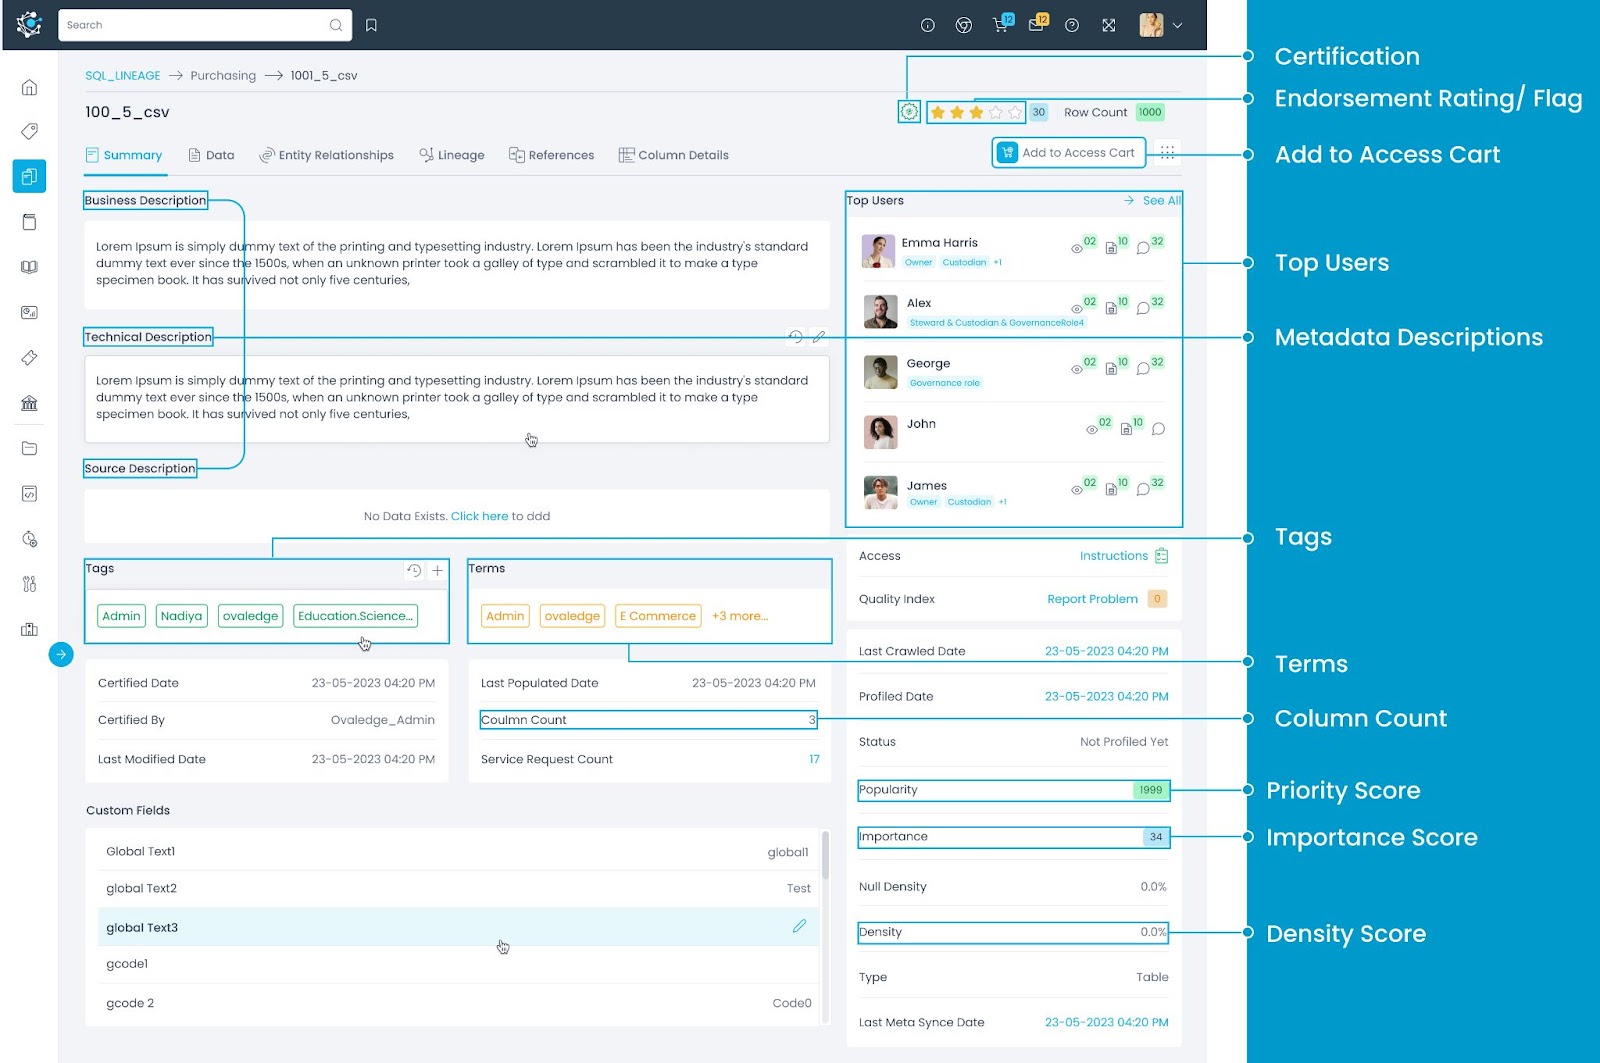
This article aims to provide users with a comprehensive overview of the fields available on the summary page of data objects within a Data Catalog. It covers the fields related to crawling, profiling, and other curatable components, highlighting their importance in organizing and managing data effectively.
Data Object Name
The name of the data object being crawled. This could be a table, file, report, or column.
Certification Status
Certification is specific to governance stakeholders who have the authority and expertise to evaluate and rate the data objects. It serves as an indication of the data's reliability and trustworthiness.
Endorsement Rating
Endorsements help users to build trust in a data object based on how other users have perceived it. It is the collective average of all the ratings given by different users. The data object can be endorsed by giving a star rating or raising a red flag in case of any issue in the data object.
Historic Row Count
It provides the current row count of the data object. When clicked, it redirects to the 'Compare Profile Results' page, where a comprehensive history of the profiling conducted on the data object is presented in a clear manner. This comparison includes the current profiling details compared with the last performed profiling, focusing on row count, Importance, and Popularity score.
It displays the previous and current profiling details of each profiling statistic side-by-side. The side-by-side comparison includes essential information such as column position, column name, column type, top value, null count, distinct count, max value, and min value. By having all these details exclusively aligned, allows for easy comparison between the two profiling instances, enabling users to identify any changes or trends in the data from different profiling sessions.
Add to Projects
Data objects are added to any project set as the default project. For example, a team is working on a project called "Customer Feedback Analysis." By setting this project as the default, data objects (referred to as tasks in projects) related to customer feedback can be easily added to the project. This ensures that all team members have quick access to the relevant data objects and can collaborate and effectively work around the data objects.
Adding Data Objects to the Access Cart
When the Access Cart is set as the default project, it serves as a centralized access request management system. Users can add multiple data objects to the cart and raise access requests in bulk. This simplifies the process of managing and tracking access permissions for the selected data objects, improving efficiency in granting appropriate access to users on the data objects.
Collaboration
OvalEdge provides a powerful Collaboration messaging feature to foster seamless communication and collaboration among users within the application. The chat-like icon is enabled on specific pages and users who have access to that particular object can share messages, discuss relevant topics, and collaborate within the context of that specific item.
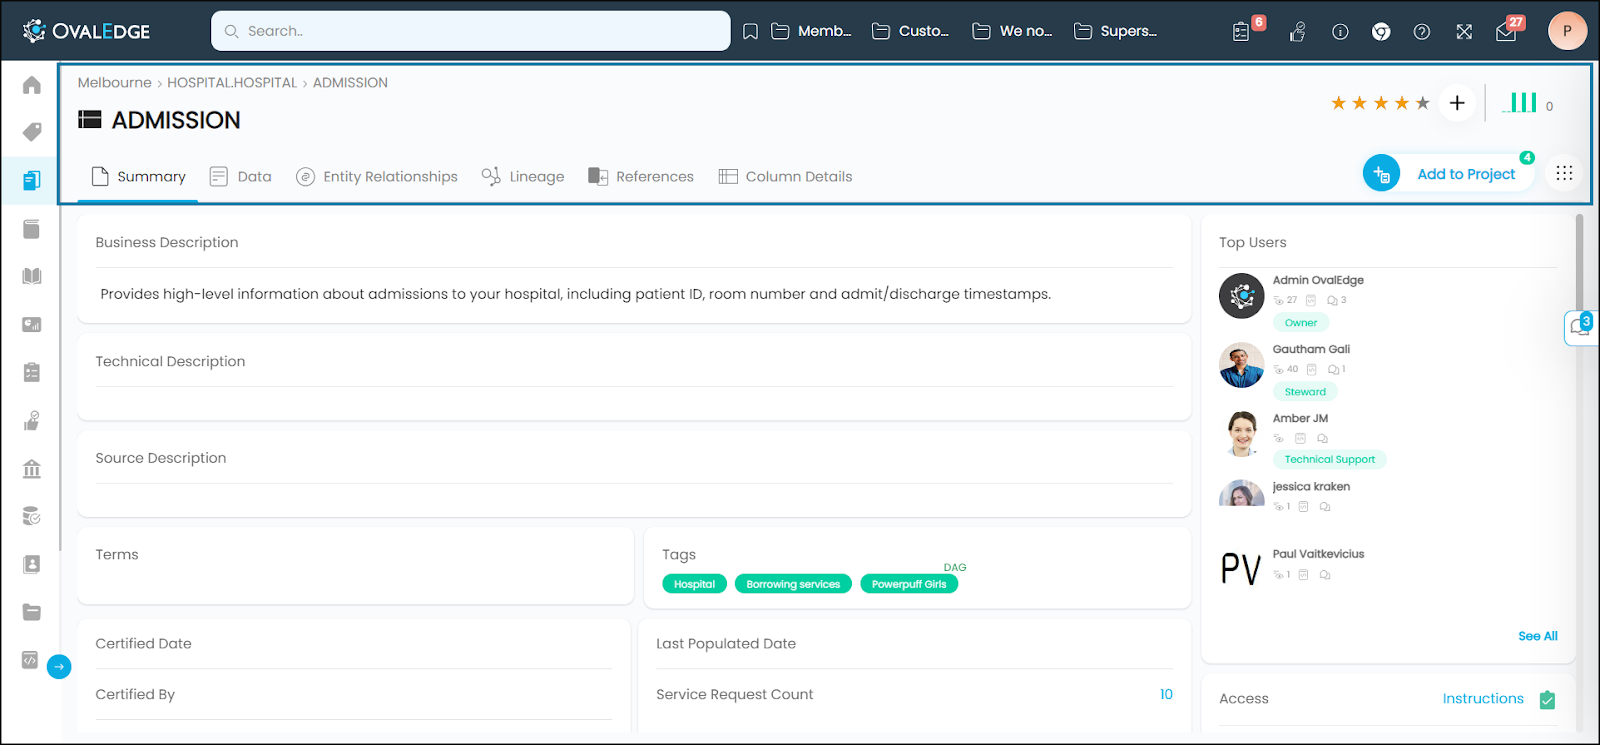
Business Description
It represents the business purpose for creating a particular data asset (Tables/Reports/Files). Users with Meta-write permissions can edit the business descriptions. Users can attach images, links, videos, or tables, and apply a few basic formatting options to the text, add object references using @ annotation.
Technical Description
Technical Description serves as a valuable resource for users who require in-depth knowledge of the technical specifications associated with a data object. It contains information such as formulas, connection details, data integration details, or any other technical aspects that are essential for understanding and working with the data object effectively.
Source Description
Source Description displays the comments added to the data objects at the remote source. If any technical description is included on a data object at the source, it will automatically get populated in the source description on Ovaledge. This field is non-editable.
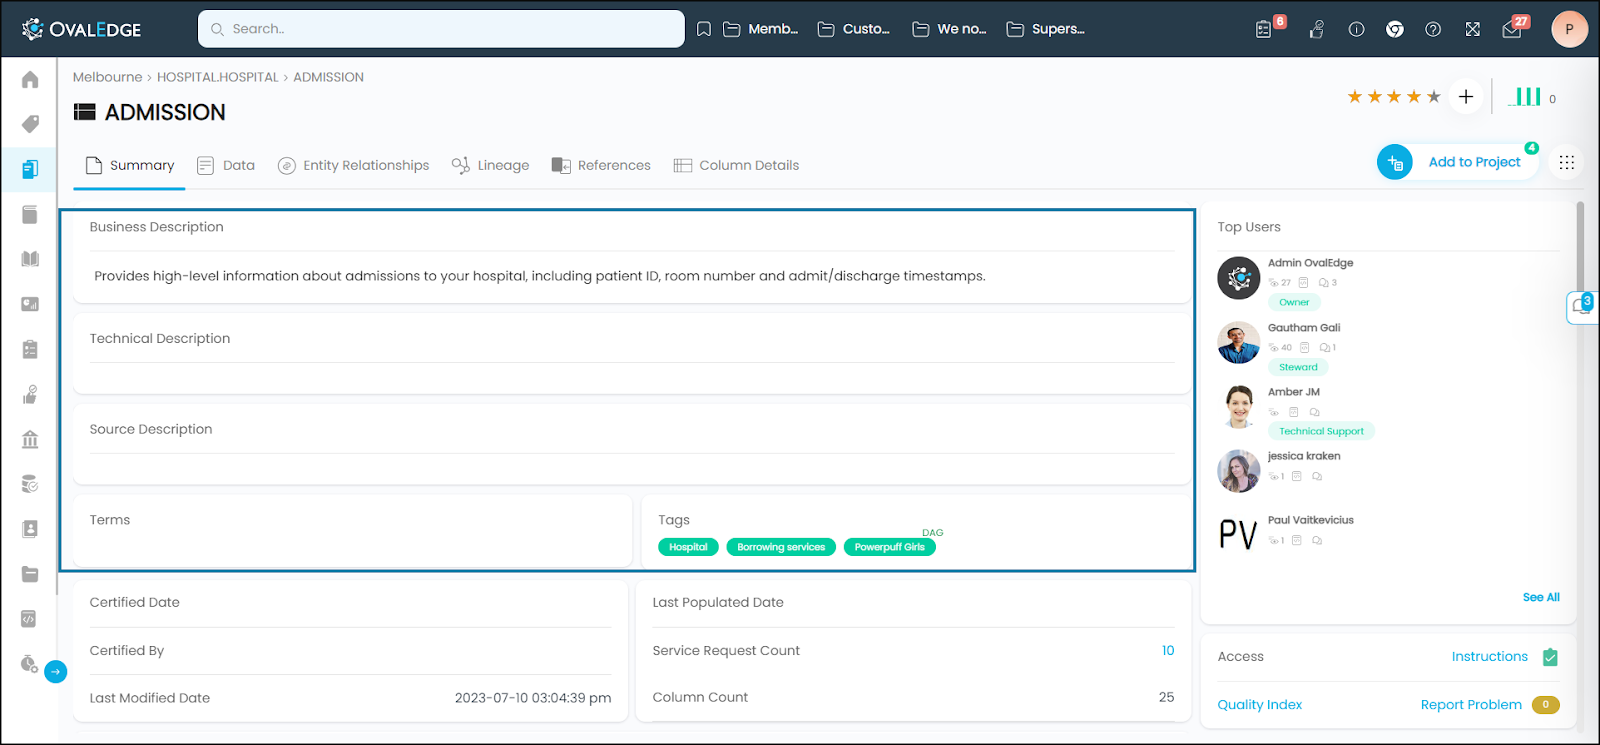
Terms
Terms are unique and standard definitions that define an organization's key processes, concepts, and data assets. A Term consists of a business description, policies, and procedures that enhance business metadata on physical data assets. It helps to classify data objects and simplifies data discovery.
This section outlines the business term, its relationships, masking policies, associated data objects, and classification.’
Tags
Tags are keywords that help users to organize the data assets for better management and discovery. Users can select and add appropriate tags from the list of existing tags in the left panel by clicking on the ‘+’ icon next to the tag.
Users can view a list of all the Tags assigned to the Term in the right panel drop-down menu. To remove tags from a term, the user can click on the ‘x’ icon next to the tag.
Certified Date
Certified Date indicates the date and time when a certification status, such as Certified, Violation, Caution, or Inactive, is applied to a data object in an application.
Example: suppose an object containing personal information is certified on May 1st, 2023. In that case, the Certified Date will reflect that date and time, indicating that the data object has been certified then.
Understanding and keeping track of these different dates in your data catalog can help you effectively manage and utilize your data objects within the OvalEdge application.
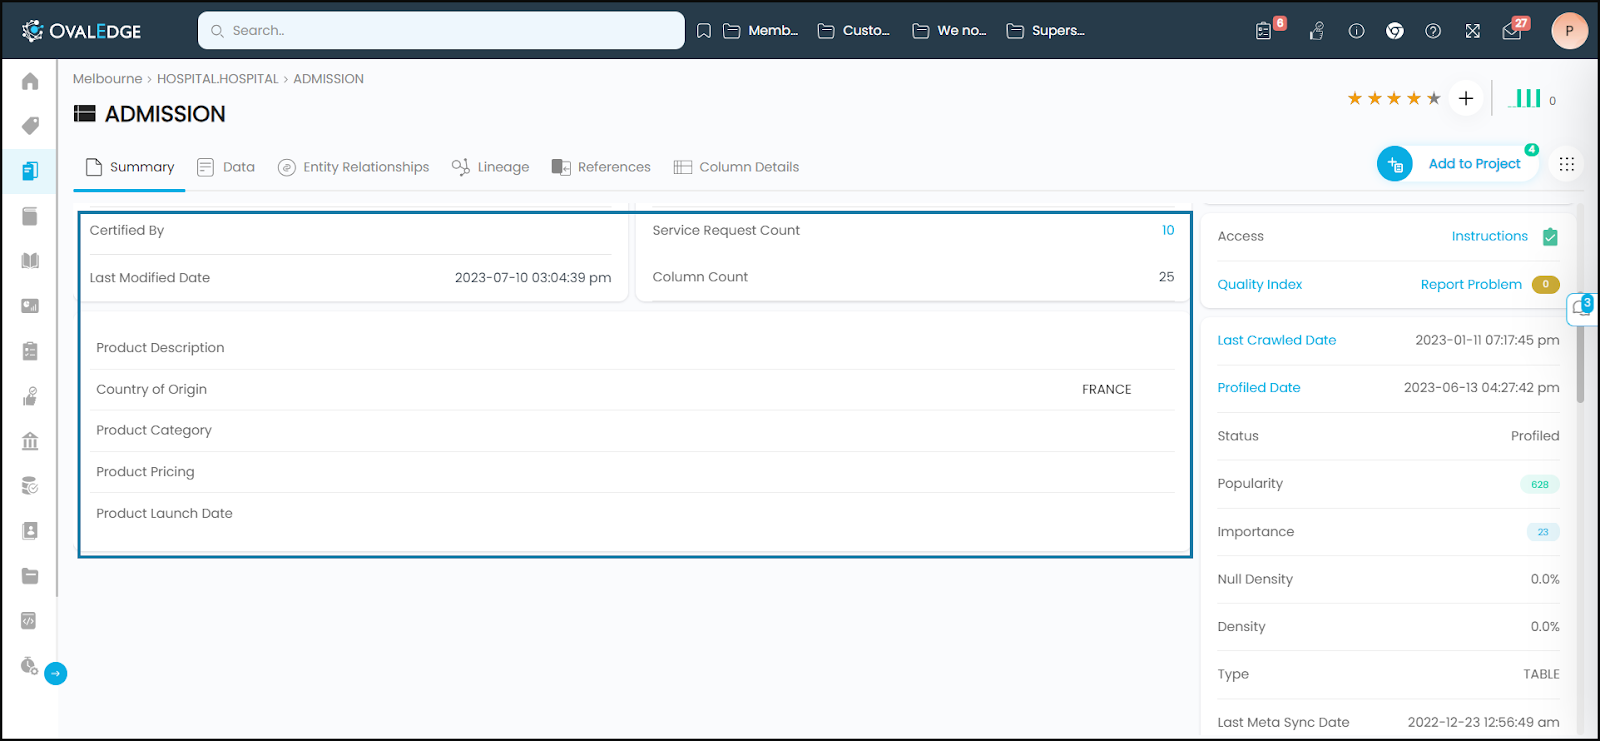
Certified By
Certified By displays the user name who certified the data object.
Last Modified Date
It displays the date and time on which any meta-data changes are made to a data object in the application. For Example: If a Business Description of a data object is changed on Jan 1st and crawled on Jan 5th, then the Last Modified Date will display as Jan 5th since the changes made to a data object are only updated after crawling. However, if the same data object is crawled again on Jan 12th with no data record changes made to the Table, then the Last Modified Date will display as 2022-01-05 04:53:24 pm.
Last populated Date
Last Populated Date displays when new data objects are created in the OvalEdge application, along with their corresponding metadata, through APIs. The Last Populated Date must be entered manually before executing the APIs; otherwise, it will not appear in the summary details of the data object.
The following APIs can be used to update the Last Populated Date:
- Table API > save/update Tables
- File API > save file
- Report API > add report
Service Request Count
Displays the number of service requests raised on a data object.
Column Count
Displays the total number of columns in a table.
Custom Fields
Custom fields allow users to add additional information to data beyond the standard fields. This additional context makes data analysis more meaningful and helps uncover insights that might not be apparent from the raw data alone.
Top Users
Top Users are the most active users who have interacted with the data object by viewing, commenting, and collaborating on the data object.
Access Instructions
The Integration Administrator provides access instructions during the setup of connector settings, clearly defining the necessary permissions and access that roles and users must have on specific schemas and data objects within that connector. These instructions also outline any restrictions that need to be followed.
Access instructions provide essential details on necessary permission and access that roles and users must have on specific schemas and data objects within that connector.
In addition to describing a user's access and permissions, the instructions also outline the specific actions that can be performed on that connection.
These guidance related to a specific data asset, ensuring security measures are in place.
Quality Index
The Quality Index serves the purpose of providing a comprehensive overview of data quality for a specific data object.
- It displays essential information such as the Data Quality Score, which gives an overall assessment of the data's reliability and accuracy.
- Additionally, it shows the status of the Data Quality Rules Run, indicating the execution of various checks and validations on the data.
- It includes records of any Service Requests (Data Quality) raised for the data object. These service requests are used to report and address data quality issues, such as data corrections or clarifications.
Furthermore, the Quality Index offers a convenient "Report Problem" clickable link, which enables users to navigate to the Service Request page directly. From there, they can raise new data quality issue service requests related to the specific data object, streamlining the process of resolving data quality concerns and promoting effective data governance.
Last Crawled Date
The Last Crawled Date shows the date and time when an object was last crawled into OvalEdge. It provides information on the most recent crawl activity for the object. You can click on the Last Crawled Date to navigate to the Metadata Changes page, and view any added, deleted, or updated metadata.
In this example, the Last Crawled Date for the "Customers" table in OvalEdge would show 2023-04-09. This date represents the most recent date when the object (the "Customers" table) was last crawled into OvalEdge.
Profiled Date
Profiled Date displays the date and time when a data object has been successfully or partially profiled into OvalEdge. This is a clickable link that takes users to the ‘Compare Profile Results’ page, where they can compare and check various metrics such as the row count, important score, popularity score, and more.
Example: If a data object is profiled on April 1st, then the profiled date will be displayed as 2023-04-01 04:53:24 pm
Profiled Status
This field provides information about the current profiling status of the data object. It can have the following values:
- Profiled: Indicates that full profiling has been completed on the data object.
- NULL/Not Profiled: Indicates that the data object has not been profiled yet.
- Sample Profiled: Indicates that sample profiling has been conducted and completed on the data object.
- Partially Profiled: Indicates that the data object has been partially profiled, meaning not all data objects of the schema that can be profiled, have been fully profiled.
- Profile Failed: Indicates that the profiling process has failed for the data object.
The profiled status helps to track the progress and completeness of data profiling activities, providing insights into the availability and reliability of the profiling results.
Popularity
Popularity Score is a useful metric for understanding how widely a data object (Table, Table Column, File, etc.) is used within a group of users. This score is calculated based on the number of times users interact with the term by viewing, endorsing, commenting, or adding tags.
Importance
Importance Score shows how vital a Table object is across the database based on the number of relationships and the lineage (downstream objects) associated with the Table.
The Importance score is calculated based on the below formula:
Importance score = [200 X (no. of rows in the Table/Max row count in schema no. of columns)] + [0.1 X no of Important Columns] + [no of downstream X 7] + [PK or FK X 3].
Type
It denotes whether the object is a Table, View, API, or Materialized_View
Last Meta Sync Date
The Last Meta Sync Date indicates the date of the last crawl for data objects that have undergone changes in the remote source. It represents the synchronization of metadata between OvalEdge and the remote source.
Example: Let's assume on January 4th at 4:00 AM, a column in the "Customers" table had its width changed from 100 to 200 in the remote database. If OvalEdge crawls this data object on January 5th at 2:00 AM, the changes will be reflected in OvalEdge at that time, and the Last Meta Sync Date will be recorded as January 5th at 2:00 AM.
However, if the "Customers" table is crawled again on January 8th without any changes made to the table, the Last Meta Sync Date will still display as January 5th at 2:00 AM, since the Last Meta Sync Date only updates when changes are made to the data object.
Row Count (Table)
Row count refers to the total number of rows or records present in a specific table.
Null Density (Table)
Null density provides valuable insights into the quality and completeness of data within a table level. Understanding the null density helps assess the extent of missing or unknown values in the dataset. It can indicate potential data issues, such as incomplete data entry or data extraction problems.
A high null density suggests a significant proportion of missing values, which may impact the reliability of data analysis or statistical calculations.
|
Null Density (%) = Total Null Count / (Column Count * Row Count)) * 100 |
Let's consider an example to understand this better:
Suppose we have a table called "Employees" with the following columns:
|
Employee ID |
Name |
Age |
Salary |
|
101 |
John |
30 |
$50,000 |
|
102 |
Mary |
null |
$60,000 |
|
103 |
Michael |
35 |
null |
|
104 |
Adam |
null |
null |
|
105 |
Sam |
null |
$45,000 |
In the given example, the "Employees" table has 4 columns:
Column Count: 4 (Employee ID, Name, Age, and Salary)
Row Count: 5
The total null count in this table is 5.
Null Density = (Total Null Count / (Column Count * Row Count)) * 100
= (5 / (4 * 5)) * 100 = 25%
The null density for this table is 25%. This means that 25% of the cells in the table have null values.
Density (Table)
The density refers to the percentage of distinct values present in the table. It provides an indication of the uniqueness of the data within the table.
|
Density (%) = (Total Distinct Count / (Column count * Row count)) * 100 |
Let's consider an example to understand this better:
Suppose we have a table called "Employees" with the following columns:
|
Employee ID |
Name |
Age |
Salary |
|
101 |
John |
30 |
$50,000 |
|
102 |
Mary |
30 |
$60,000 |
|
103 |
Michael |
35 |
null |
|
104 |
Adam |
35 |
null |
|
105 |
Sam |
30 |
$45,000 |
In the given example, the "Employees" table has 5 columns:
Column Count: 4 (Employee ID, Name, Age, and Salary)
Row Count: 5
The total Distinct count in this table is 15.
Density = Total Distinct Count / (Column Count * Row Count)) * 100
= 15 / (4*5) * 100
= 75%
A high density suggests that the data values are distinct within the data object or a specific column. A low density indicates a more diverse or spread-out distribution of values within the data object or a specific column.
Type
Indicates the type of data object, whether it's a table, file, report, or column. At column level, it denotes whether the column denotes an integer, varchar, char, date, time, boolean, decimal, float, text, etc.
Key (Column)
If a column serves as a primary key, this field identifies that specific column.
Classification (Column)
The classification is linked to the terms associated with the data objects. If a particular associated term has a classification selected, that classification is then automatically applied to the corresponding column. This ensures consistent and appropriate handling of data based on its sensitivity or confidentiality level. For instance, classifications like Sensitive, Restrictive, Confidential, Internal, Public, etc., can be established to suit their data protection needs.
Nullable (Column)
Nullability of a column is an important consideration in understanding the data integrity and usefulness of the table. At the time of crawling, the table columns are defined as whether the particular Table column can be allowed to contain Null values or not.
If set to True - a column is allowed to contain null values, which represent the absence of a value.
If set to False - a column must have a complete set of data and can never have blank cells.
Null Value (Column)
Null Count and Null Density percentages are statistics that provide insights into the presence and distribution of null values within a specific column, helping to identify data completeness and quality issues.
Null Count (Column): The Null Count (Column) field provides the numerical count of null values in the same specific column. It indicates the total number of occurrences where the column has null values.
Null Density Percentage (Column): The Null Density Percentage (Column) is a statistical measure that calculates the density or prevalence of null values within a column. It is determined by dividing the Null Count by the total number of rows in the column and then multiplying by 100 to get a percentage.
|
Null Density (%) = (Null Count / Row Count) * 100 |
For example, let's consider a table with the following data:
|
Age |
|
30 |
|
null |
|
null |
|
25 |
|
40 |
In this case, the Null Value (Column) for the "Age" column is 2, indicating that there are two occurrences of null values within that column.
The Null Count (Column) for the "Age" column is also 2, as it represents the count of null values specifically within that column.
To calculate the Null Density Percentage (Column) for the "Age" column, we need to consider the total row count. Row count is 5 in this example.
Null Density Percentage (Column) = (Null Count / Row Count) * 100 = (2 / 5) * 100 = 40%
Therefore, the Null Density Percentage (Column) for the "Age" column in this case is 40%. It indicates that 40% of the values in the "Age" column are null.
Distinct (Column)
Distinct Count and Distinct Percentages are statistics that provide insights into the uniqueness and diversity of values within a specific column.
- Distinct Count: Distinct Count represents the number of unique or distinct values present in the column. It counts the unique elements without considering their frequency of occurrence. The higher the distinct count, the greater the variety and diversity of values within the dataset or column.
- Distinct Percentage: Distinct Percentage indicates the proportion of distinct values in relation to the total number of values in the column. Distinct Percentage helps to understand the relative prevalence or concentration of distinct values within the column.
|
Density (%) of Column = Distinct values in the Column / Total values in the Column * * 100 |
For example, let's consider a dataset containing the "Age" column:
|
Age |
|
30 |
|
35 |
|
30 |
|
40 |
|
35 |
In this case, the distinct count for the "Age" column is 3 (30, 35, 40). It indicates that there are three unique values present.
Distinct Percentage = (Distinct Count / Total Count) * 100
The total count of values in the "Age" column is 5, the distinct percentage would be:
Distinct Percentage = (3 / 5) * 100 = 60%
This means that 60% of the values in the "Age" column are distinct or unique.
Minimum Value (Column)
The minimum value represents the smallest or lowest value observed in a specific column. It helps to understand the lower limit or the starting point of the data range.
|
Employee ID |
Name |
Age |
Salary |
|
101 |
John |
25 |
$50,000 |
|
102 |
Mary |
30 |
$60,000 |
|
103 |
Michael |
35 |
null |
|
104 |
Adam |
30 |
null |
|
105 |
Sam |
40 |
$45,000 |
For example, considering the same "Age" column:
Minimum Value for Age: 25
In this case, the minimum value for the "Age" column is 25, indicating that 25 is the smallest value in the column.
Maximum Value (Column)
The maximum value represents the largest or highest value observed in a specific column. It provides insights into the upper limit or the highest point of the data range.
|
Employee ID |
Name |
Age |
Salary |
|
101 |
John |
25 |
$50,000 |
|
102 |
Mary |
30 |
$60,000 |
|
103 |
Michael |
35 |
null |
|
104 |
Adam |
30 |
null |
|
105 |
Sam |
40 |
$45,000 |
Continuing with the "Age" column example:
Maximum Value for Age: 40
In this case, the maximum value for the "Age" column is 40, indicating that 40 is the largest value in the column.
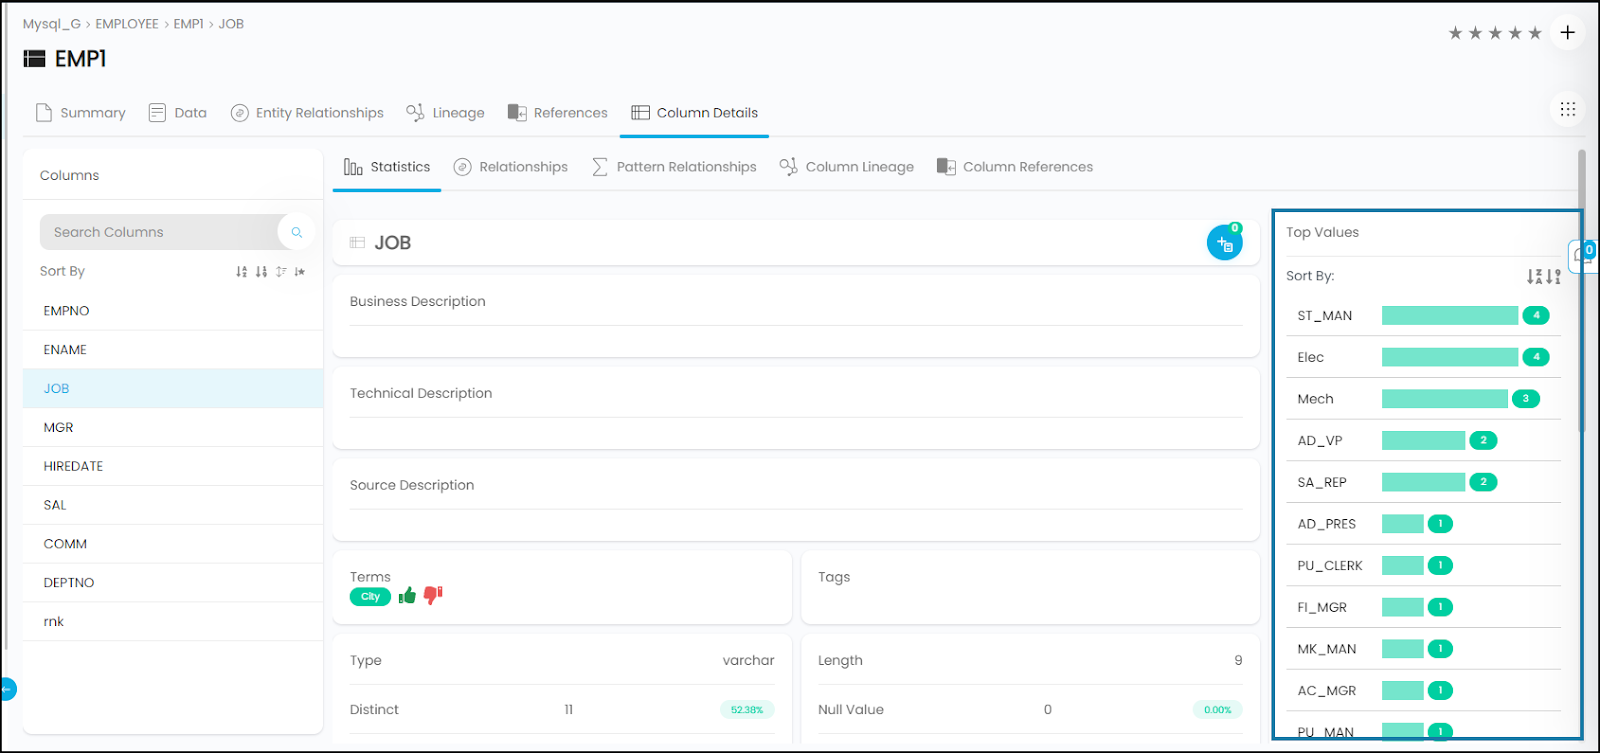
Top Values (Column)
Top values are the values that occur most frequently or have the highest frequency of occurrence. It helps in understanding the distribution of data, identifying dominant patterns or trends, and detecting potential outliers or anomalies.
Last Cataloged Date (Files)
The Data Catalog displays the cataloging date of files or folders added from the File Manager. When an ETL or File-related data source connection is established and crawled, the metadata details of the data source are stored in the File Manager, considering the large volume of file sizes.
Users have the option to catalog their preferred files or folders into the Data Catalog under specific files or file columns. The date associated with each entry denotes the last date when the respective file or folder was cataloged into the Data Catalog. This information helps users track when a specific Folder or File is cataloged.
Example: If crawling was performed on an ETL connector on 2023-04-09 the metadata details of the Files are stored in the File Manager. However on a later date say 2023-05-11, if a specific folder is cataloged from the File Manager into the Data Catalog > Files, the Catalogued Date gets updated to 2023-05-11 for that specific File or Folder that has been cataloged.
Type (Files)
Type denotes whether it is a "Folder" or a "File". A file is a single piece of information or data. A folder, on the other hand, can hold multiple files and other folders.
Type (File Column)
File Column Type represents the data type or values the column holds. Some common data types OvalEdge supports are Integer, Date, String, Float, etc.
Type (Report Column)
Report Column Type represents the data type such as measures, dimensions, KPI (Key Performance Indicators) etc.
VisibleType (Report Column)
For Tableau Connectors, this option offers users the ability to control the visibility of Report columns by toggling their status between “Visible - Active" and "Invisible - Inactive”. This functionality enables users to show or hide specific columns based on their needs.
Formula (Report column)
This field displays the formula or logic used to generate the report, which is based on the columns involved in the data processing. It provides transparency into the calculations and transformations applied to the data, helping users understand how the report's values are derived from the underlying data.
Path (Report)
It represents the path or location of the report within the system.
Dashboard (Report Column)
If a report has multiple columns, this field specifies the column's position within the report's dashboard.
Job Type (codes)
When dealing with codes or scripts, this field denotes the type of job associated with the code, such as View, Function, Procedure, Trigger, workflow, extraction, transformation, loading, etc.
Last Run Date (Codes)
This field represents the date when the specified codes were last executed or run.
Lineage Status (Codes)
The "Lineage Status" in the codes denotes the status of the lineage. to indicate whether the lineage processes have been successfully carried out on the code. As Data Catalog - Codes include codes that have been obtained through automated crawling and cataloging from remote data sources, as well as those that have been executed manually on the OvalEdge instance. Whenever a code is associated with other data objects, it requires a "build lineage" to be executed.
List of Crawling & Profiling attributes
- Crawling fetches the metadata (data about data i.e, the name, source description) details of the data from the remote data source to the OvalEdge application.
- Profiling involves gathering statistical information about a data object by analyzing the data and its structure i.e, the completeness, density, max values, min values ect from the remote data source. When profiling is performed, several profile statistics are captured from the remote source, which is instrumental in data cleaning, analysis, and decision-making processes.
|
Crawling Attributes |
Profiling Statistics |
|
Schema |
|
|
Name |
Row Count |
|
Source Description |
Column Count |
|
Table Count |
Status |
|
Last Crawled Date |
|
|
Last Modified Date |
|
|
Table Count |
|
|
Table Column Count |
|
|
Tables |
|
|
Name & Title |
Row Count |
|
Source Description |
Density |
|
Table Count |
Null Density |
|
Last Crawled Date |
Status (Profiling Status) |
|
Last Modified Date |
|
|
Type |
|
|
Column Count |
|
|
Column Position |
|
|
Column Names |
|
|
Table Columns |
|
|
Name |
Distinct |
|
Source Description |
Null Value |
|
Type |
Minimum Value |
|
Length |
Maximum Value |
|
Key |
Top Values |
|
Data Type Size |
|
|
Files (Folders) |
|
|
File / Folder Name |
Profiled |
|
Source Description |
Size |
|
Last Cataloged Date |
Profile Type |
|
Type - Folder or File |
Distinct |
|
File Columns |
|
|
File Column Name |
Null Value |
|
Source Description |
Minimum Value |
|
Type |
Maximum Value |
|
Reports (Reporting Tools) |
|
|
Report Name |
N/A |
|
Source Description |
N/A |
|
Last Modified Date |
N/A |
|
Last Crawled Date |
N/A |
|
Type |
N/A |
|
Column Count |
N/A |
|
Workbook |
N/A |
|
Path |
N/A |
|
Report Columns |
|
|
Report Column Name |
-N/A |
|
Source Description |
|
|
Type |
|
|
Last Modified Date |
|
|
Codes |
|
|
Code Name |
|
|
Source Description |
Lineage Status |
|
Job Type |
|
|
Last Crawled Date |
|
|
Last Modified Date |
|