Navigating the Report section within the Data Catalog has been a significant challenge for users, primarily due to the inadequate presentation of the report hierarchy. Additionally, the curation process needed to be improved, as there was a disconnect between Reports and their respective Columns. Several key enhancements have addressed these issues, improving user experience and curation efficiency.
Enhancements Overview
Enhanced Report Summary Page
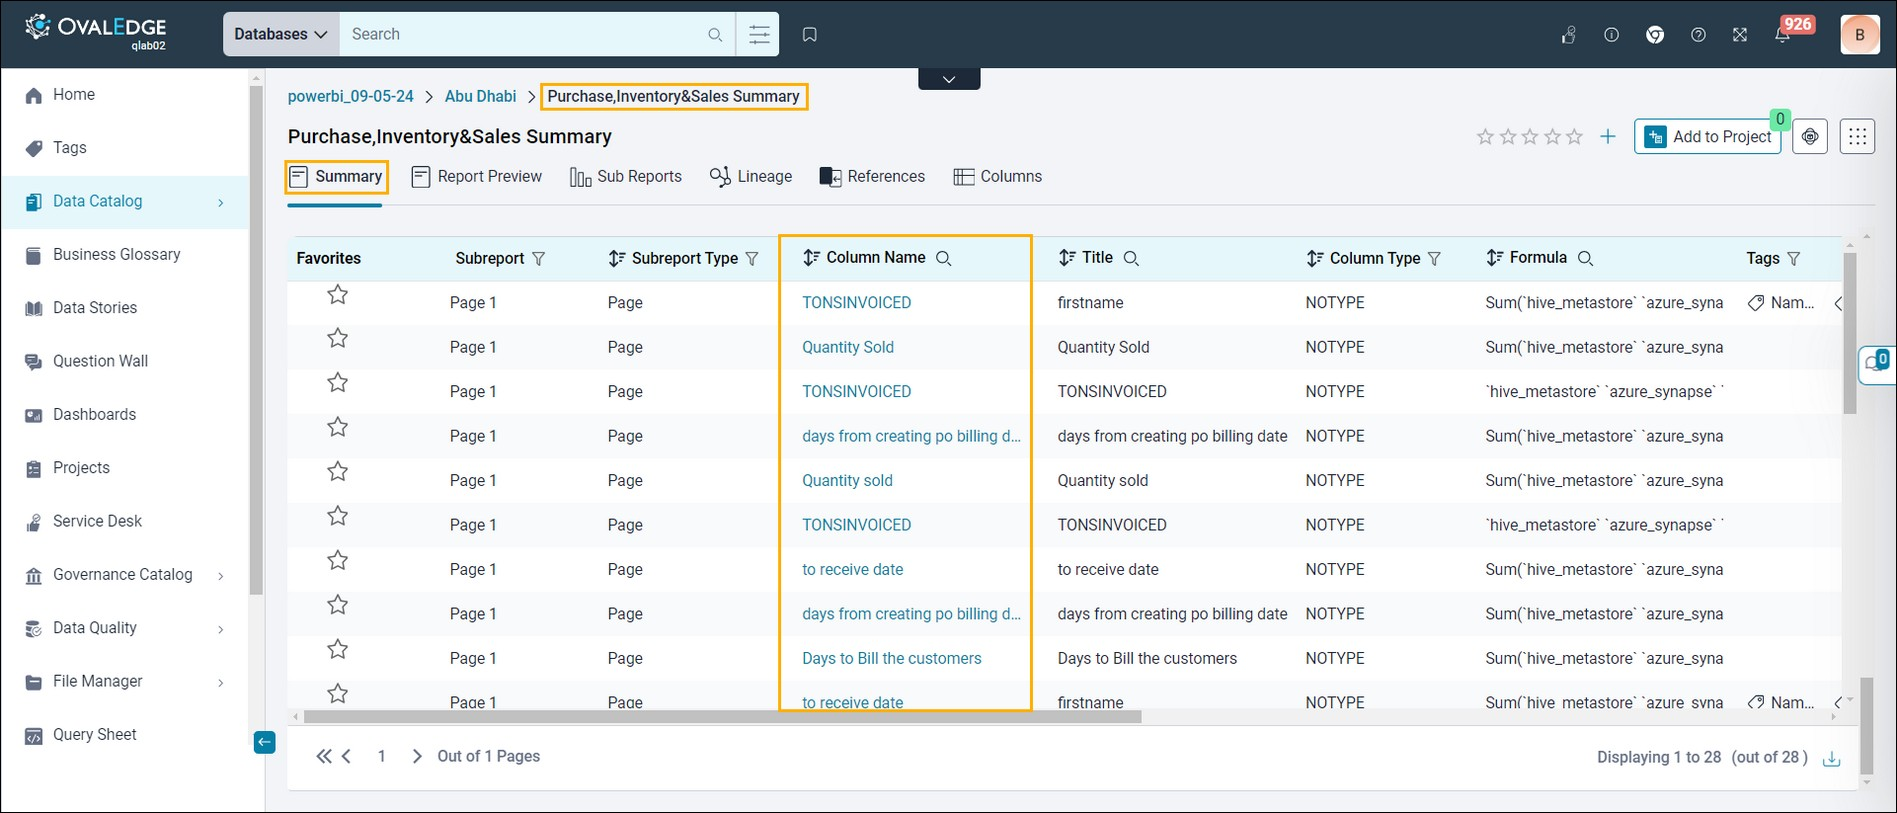
One of the critical improvements is the rebuilding of the Report Summary Page. Now, the page displays Report Columns for all Report Connectors, showing all necessary attributes for effective curation for the Author Users. This change ensures that users can see and manage all metadata related to Reports, introducing a more streamlined and intuitive curation process.
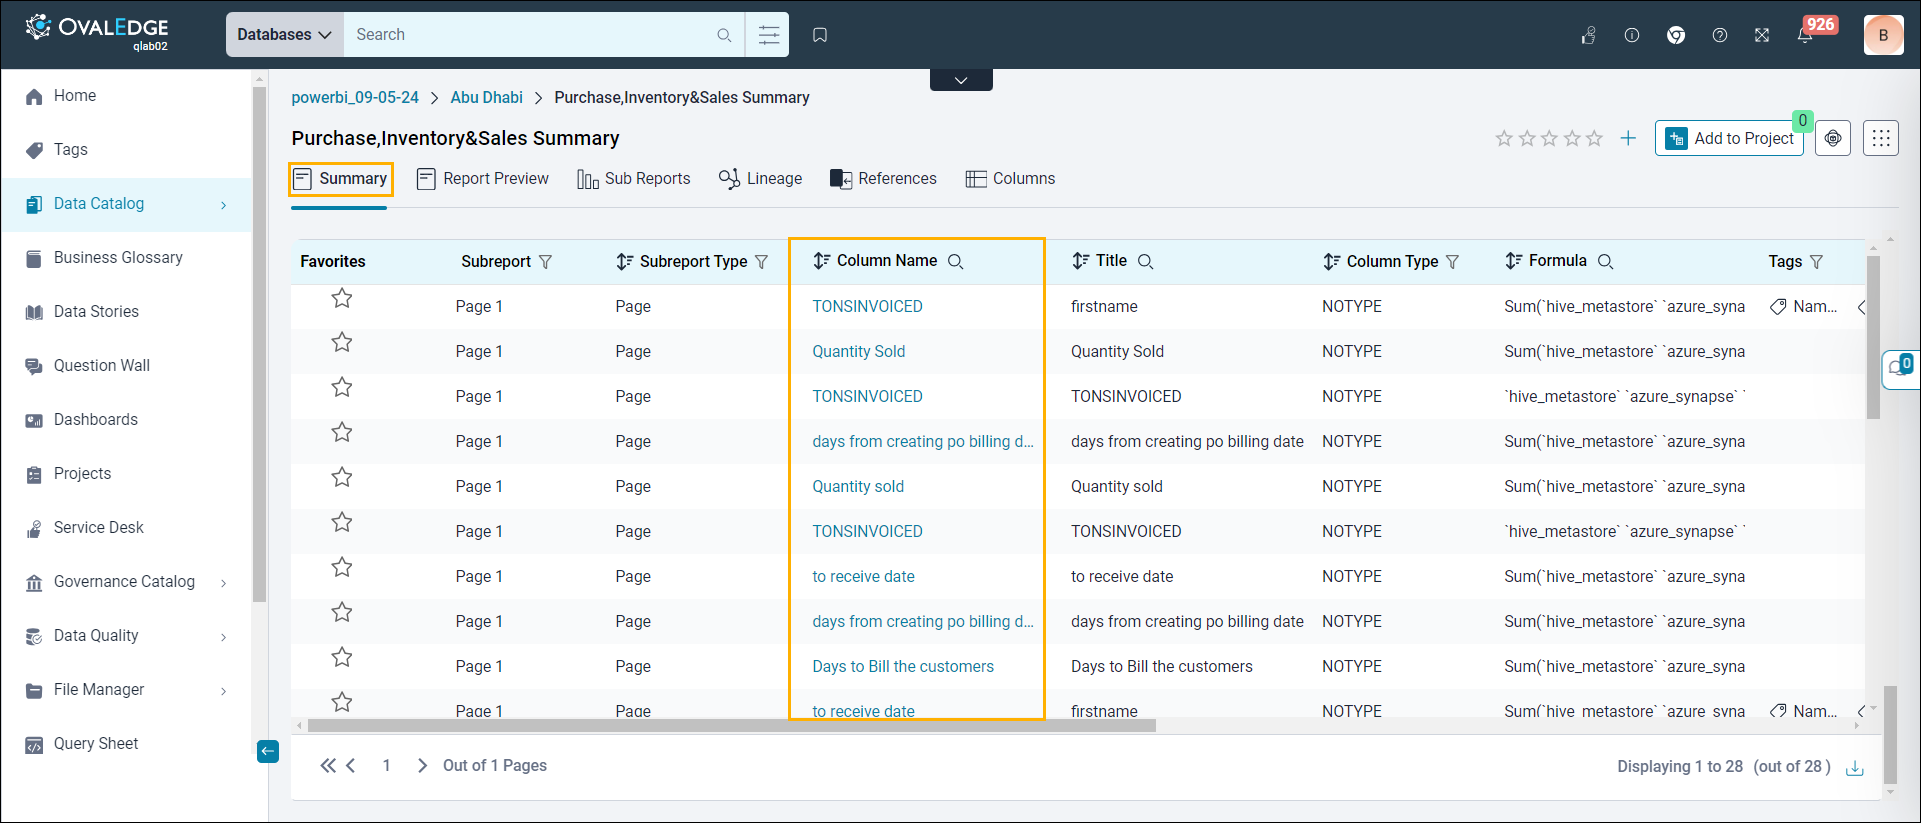
The Report Columns table on the Summary Page shows the following new columns for metadata enhancement.
- Favorites: Users can mark a column as a favorite by clicking the star in this column, which will then appear at the top of the table.
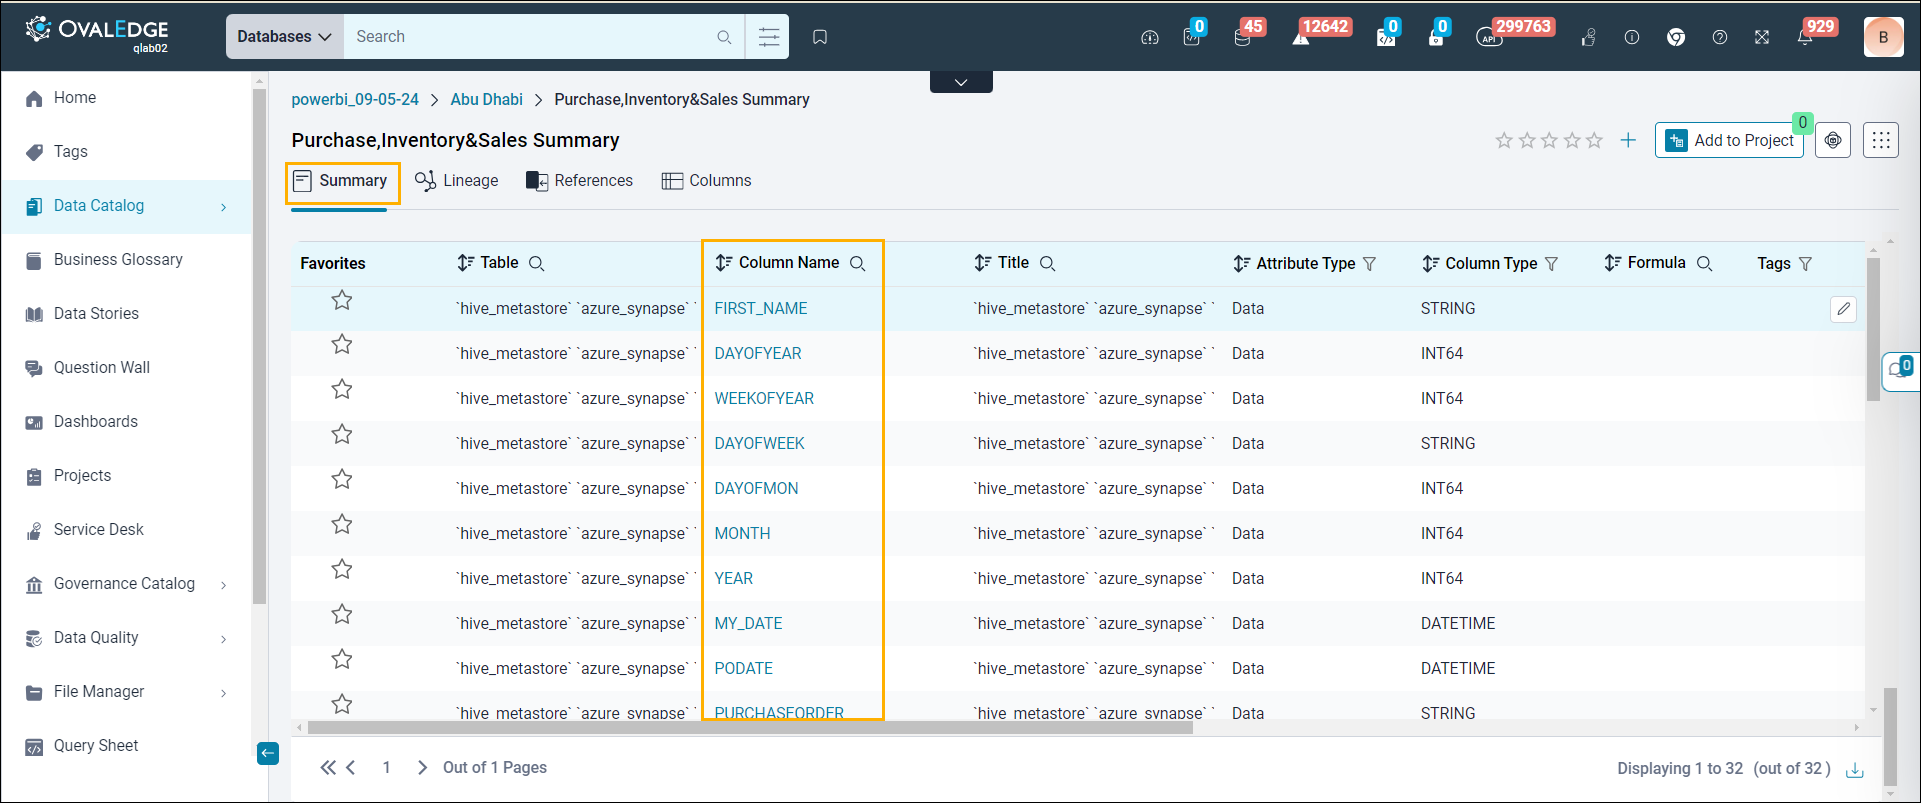
- Table (Only PowerBI - Dataset): Displays the Semantic tables associated with the Semantic Columns.
- Attribute Type (Only PowerBI - Dataset): Displays whether a Semantic Column is a Measure or a Dimension.
- Subreport (Only PowerBI - All Report Types): Displays the Subreport associated with the Report Columns.
- Subreport Type (Only PowerBI - All Report Types): Displays the Subreport type of the associated Subreport.
The other columns added for metadata editing and viewing are Title, Column Type, Tags, Terms, Project, Business Description, Technical Description, Certification, and Last Modified Date.
Introduction of a Dedicated Report Preview Tab
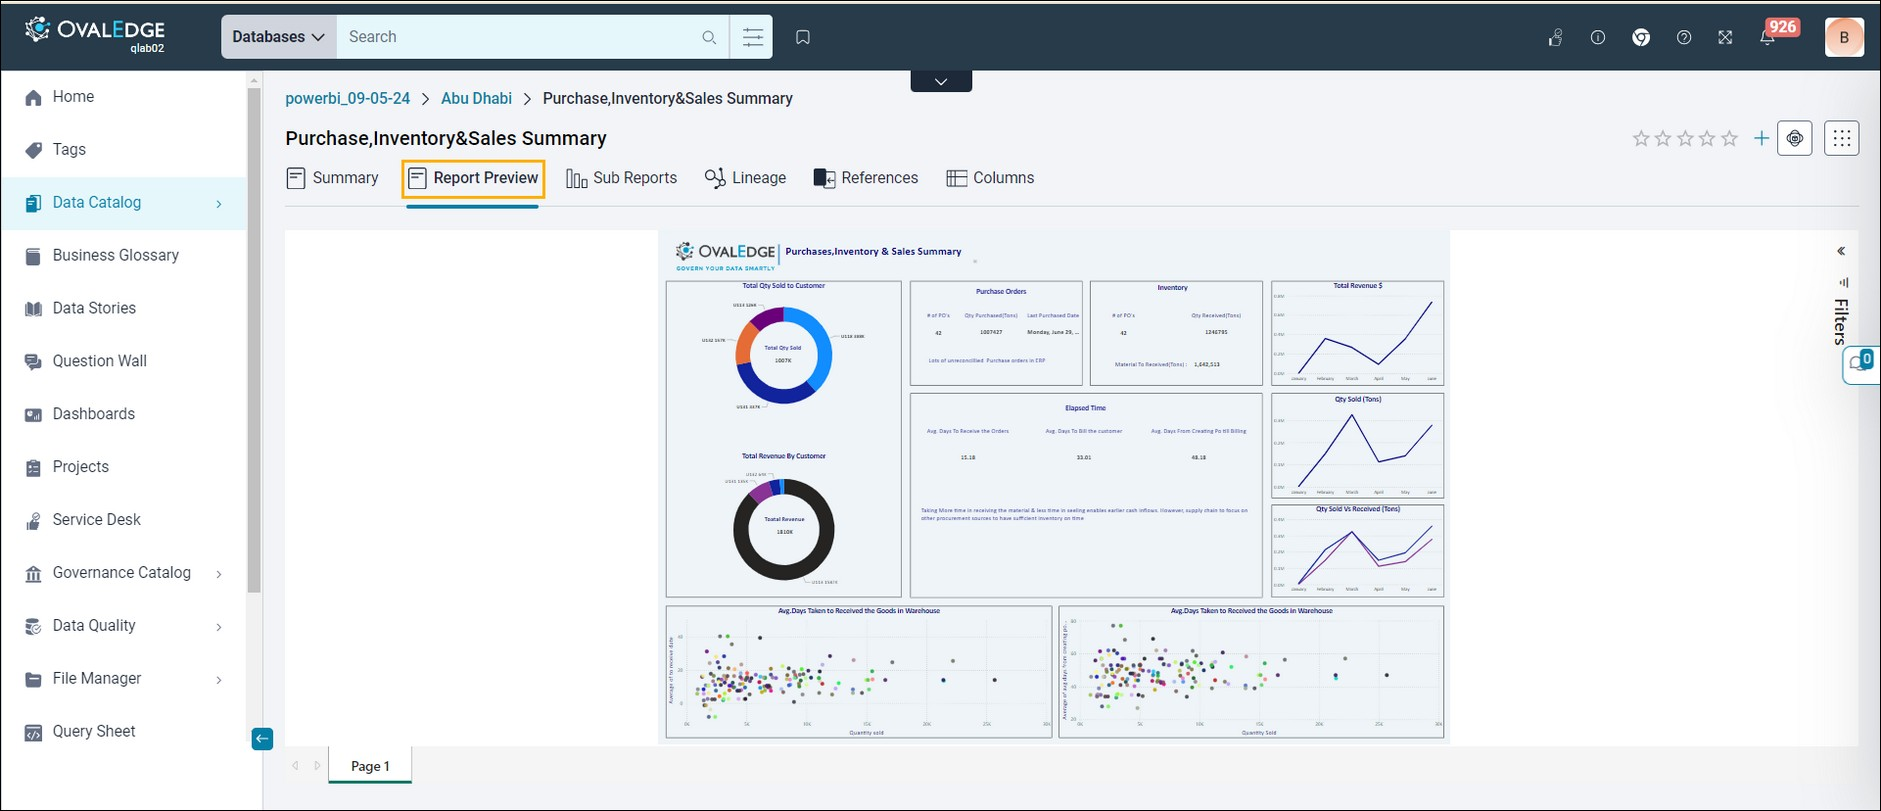
A dedicated Report Preview Tab has been added for the iFrame to assist users. This new tab significantly improves the clarity of the Source Report by providing a focused view, allowing users to access and understand the underlying data and structure of the Reports.
New Subreports Tab
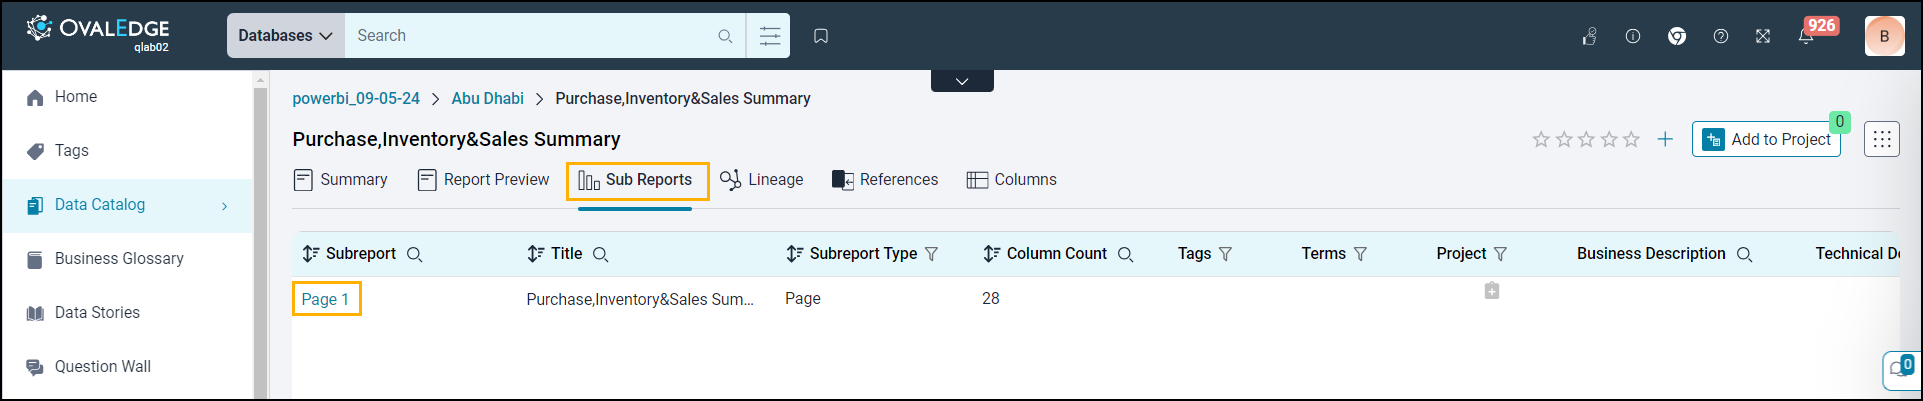
Understanding the hierarchical structure of Reports is crucial for effective data management. A new Subreports Tab has been introduced to enhance user understanding of report hierarchies. This tab displays immediate Subreports of a Report at any level, giving users a clear and organized view of the Report structure and its related subcomponents.
Improved Column Display for Power BI
Specifically for Power BI, the Report Summary Page now distinctly displays Report Columns and Semantic Columns (from the Semantic Model/Dataset) separately. Previously, these columns were intermixed, confusing and hindering the curation process. This separation brings clarity and makes it easier for users to differentiate and manage various columns. Furthermore, this improved flow will be implemented for all Report Connectors in upcoming releases, extending these benefits across the platform.
Addition of Metadata Fields in Power BI
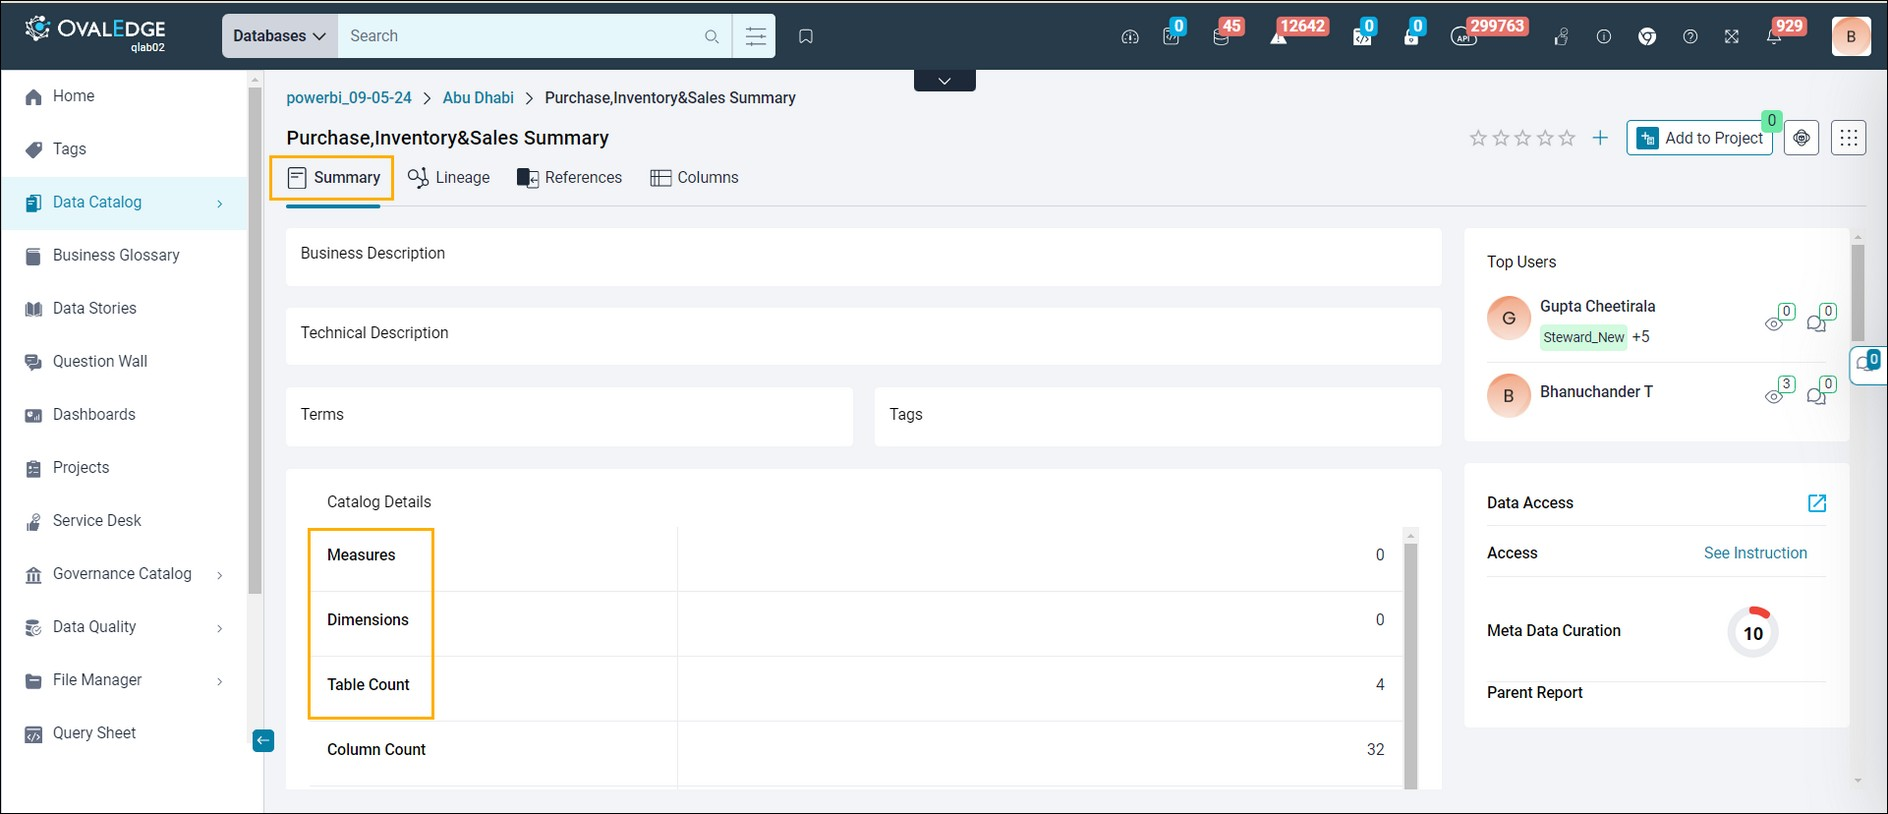
Additional metadata fields have been incorporated into the Catalog Details section of the Report Summary Pages for Power BI to provide deeper insights into the Report structure. These fields include:
- Measures: Measures are data types in PowerBI assigned to numeric or quantitative values. They are aggregated (e.g., sum, average, min, max, etc.) and used to describe the data.
- Dimensions: Dimensions are data types in PowerBI assigned to qualitative values (such as names, dates, or geographical data). They affect the level of detail in a visualization and are used to categorize and segment the data.
- Table Count: The Table Count shows the Number of Semantic Tables used in a particular Report's Semantic Model (Dataset).
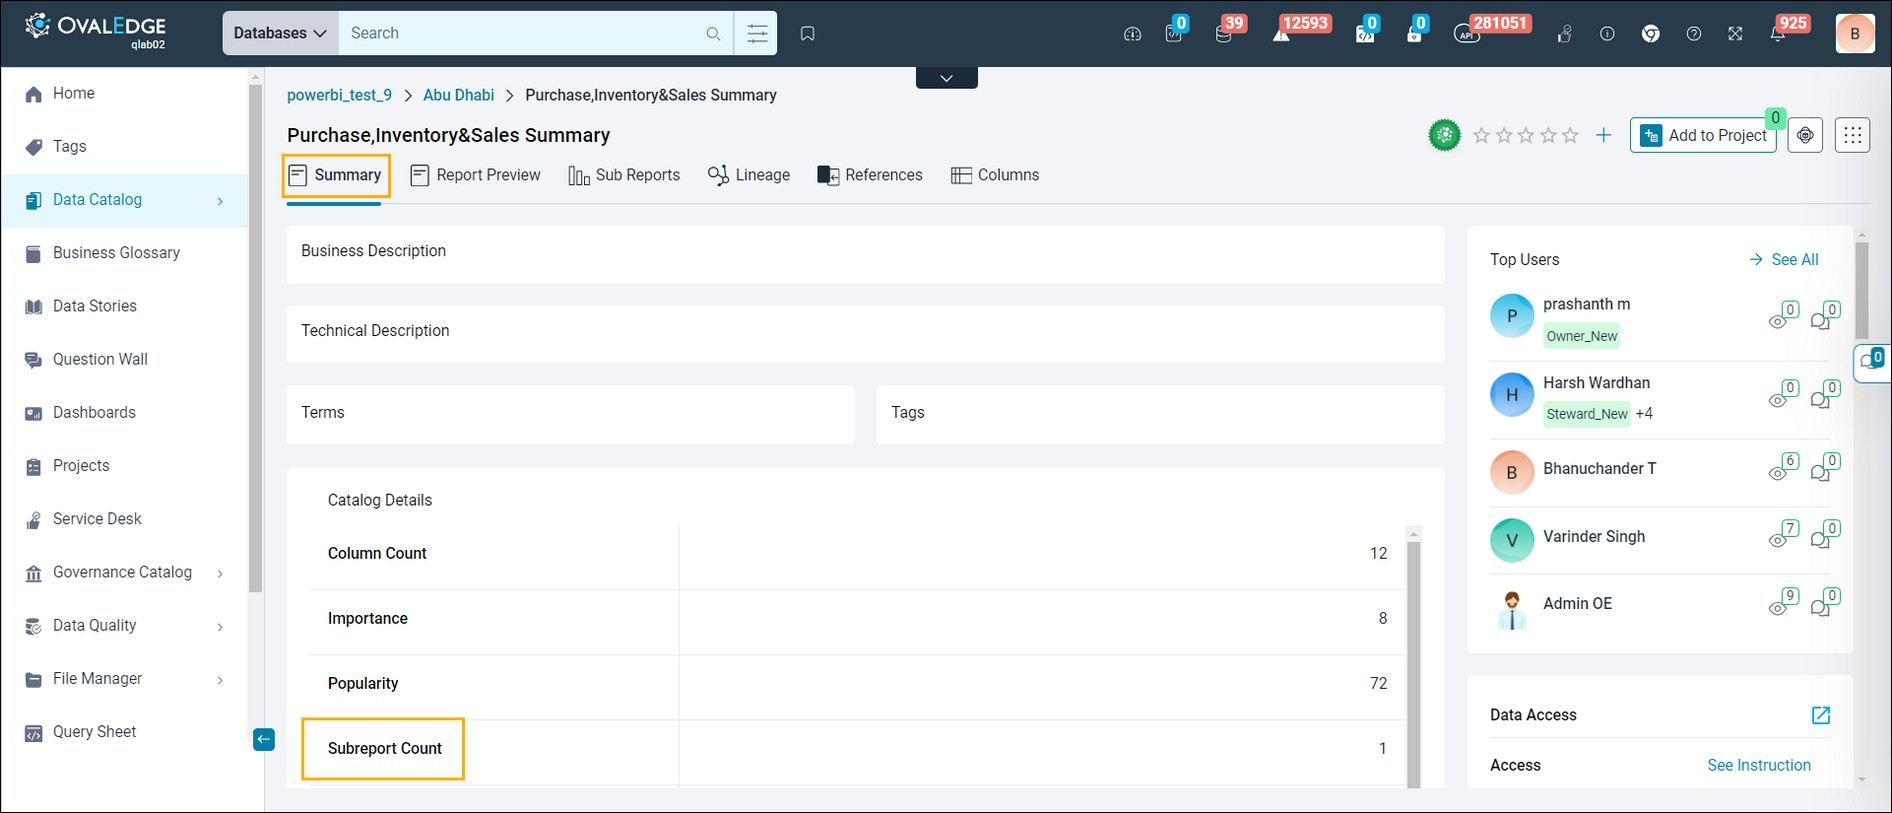
- Subreport Count: The Subreport Count defines the number of immediate subreports available for a particular report. This information is available for all the Connectors.
This improved metadata allows users to gain a more comprehensive understanding of the Report structure, facilitating better analysis and curation decisions.
Example
For the above enhancements, consider a PowerBI Report called ‘Purchase,Inventory&Sales Summary’.
The PowerBI Hierarchy is: Workspaces - (Semantic Models/Datasets) - Reports - Pages - Visual Objects - (Report Columns)
The ‘Purchase,Inventory&Sales Summary’ has the following elements for the above hierarchy.
- Workspace = Abu Dhabi
- Semantic Model = Purchase,Inventory&Sales Summary
- Report = Purchase,Inventory&Sales Summary
- Page(s) = Page 1
- Visual Object(s) = Purchase Orders, Inventory, Total Qty Sold to Customer, Total Revenue $, Total Revenue by Customer, Elapsed Time, Qty Sold (Tons), etc.
- Report Columns = UNITPRICE, RECEIVEPO, Month, TONSINVOICED, and many more.
Considering the 'Purchase,Inventory&Sales Summary' in PowerBI and its hierarchical structure, let's explore how the above enhancements apply.
- Enhanced Report Summary Page
- The Report Summary Page now showcases all Report Columns associated with the 'Purchase,Inventory&Sales Summary,' such as TONSINVOICED, Quantity Sold, TONSINVOICED, etc.
- Users can conveniently view and manage these columns directly from the summary page, streamlining the curation process and providing a comprehensive overview of the available data attributes.

- Dedicated Report Preview Tab
- With the new Report Preview Tab, users can easily explore the 'Purchase,Inventory&Sales Summary' and its components.
- Users can navigate through different pages ('Page 1', 'Page 2', 'Page 3') and view the Visual Objects ('Purchase Orders,' 'Inventory,' etc.), gaining deeper insights into the report's content and structure.
Note: This Report has only one sub-report (Page 1)
- New Subreports Tab
- Introducing a Subreports Tab enhances the understanding of the 'Purchase,Inventory&Sales Summary' hierarchy.
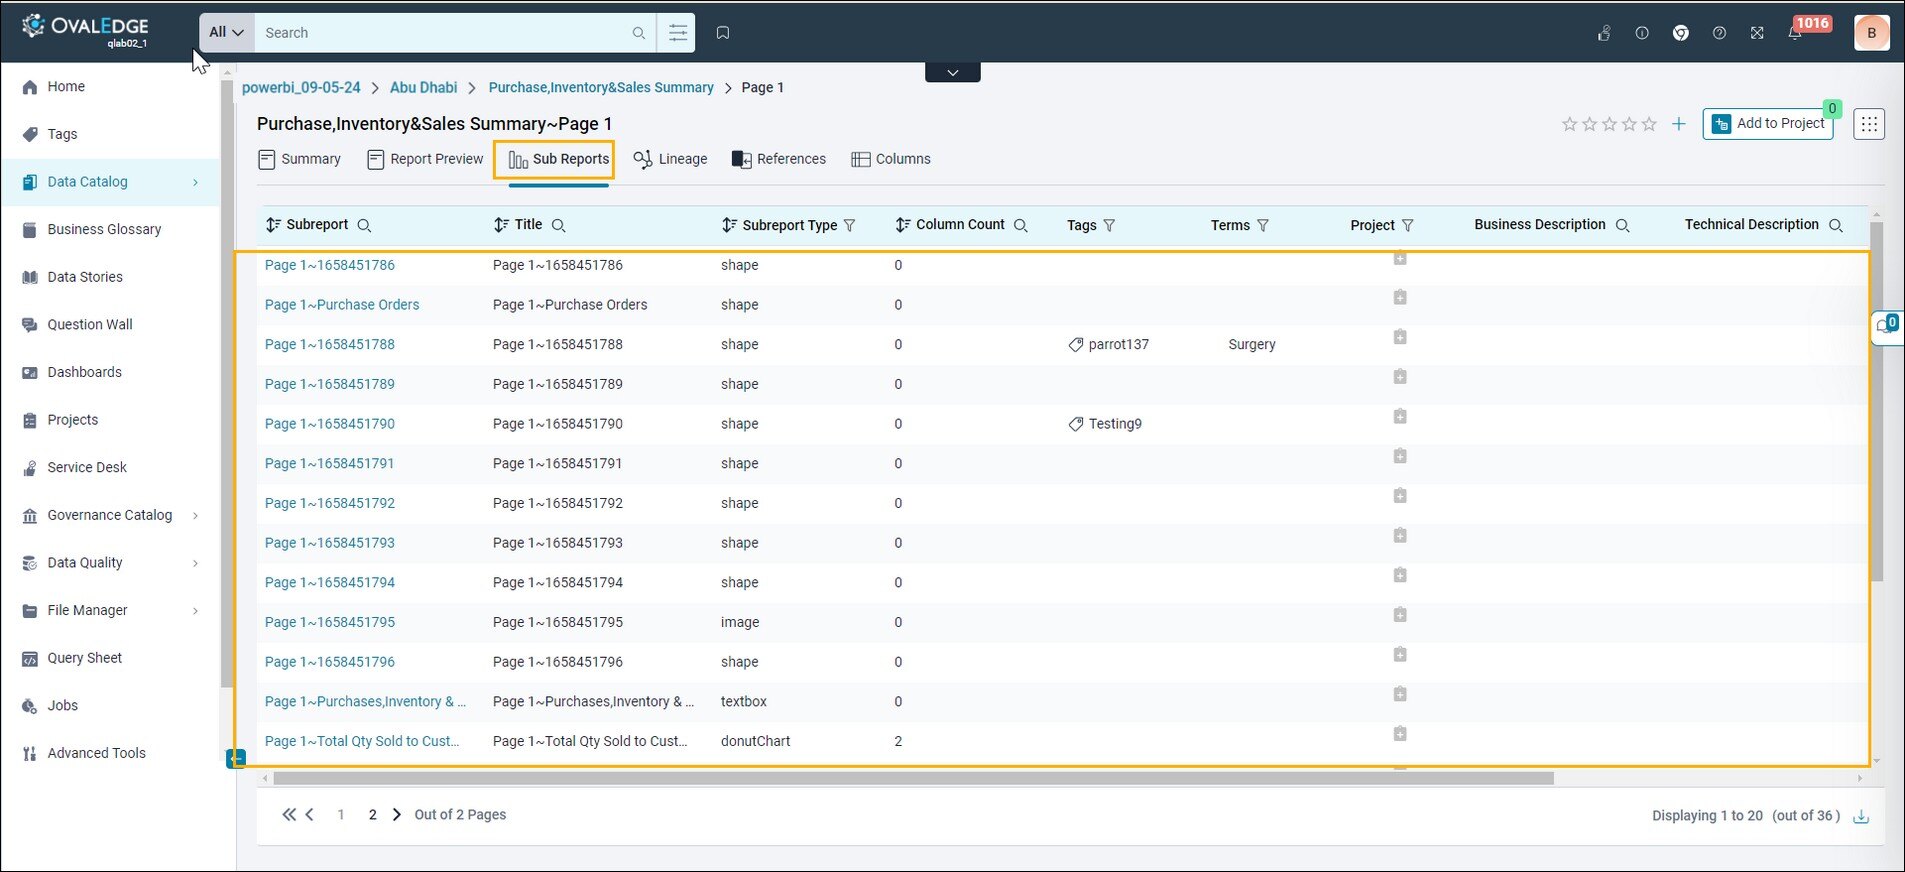
- Users can identify immediate Subreports associated with the main report, such as different pages ('Page 1', 'Page 2', 'Page 3'), allowing for efficient navigation and exploration of the report's layers. Visual Objects are also displayed as subreports for every Page.
Note: This Report has only one sub-report (Page 1) - Users can click “Page 1” from the “Sub Reports” tab, which further navigates and shows its report’s hierarchy.


- Addition of Metadata Fields.
- Metadata fields such as Measures, Dimensions, Table Count, and Subreport Count are now available in the Catalog Details section of the 'Purchase,Inventory&Sales Summary' Summary Page.
- Users can access metadata related to the 'Purchase,Inventory&Sales Summary Dataset,' including measures like Total Sales, dimensions like Year, and other relevant information. This provides valuable insights into the report's structure and content.


- Improved Column Display for Power BI.
- Specifically for Power BI, the 'Purchase,Inventory&Sales Summary' Summary Page now displays Report Columns and Semantic Columns from the 'Purchase,Inventory&Sales Summary' Dataset.
- Users can differentiate between columns belonging to the report ('TONSINVOICED,' 'Quantity Sold') and those associated with the dataset ('FIRST_NAME,' 'DAYOFYEAR'), enhancing clarity and facilitating efficient curation and analysis.
Purchase,Inventory&Sales Summary Report

Purchase,Inventory&Sales Summary Dataset