Reports are graphic visual representations of data, which are intended to present insights quickly and clearly. The purpose of a report is to organize and present information in an organized manner for a particular audience. OvalEdge has a lightweight in-built visualization application that allows you to crawl the data to build the reports. The reporting tools supported by OvalEdge are PowerBI, Tableau, MicroStrategy, Sigma, etc.
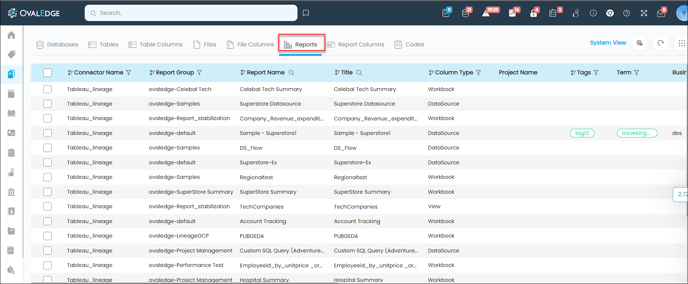
The Data Catalog > Reports summarizes information about report summary, report lineage, report references, and report column details.
|
Icons/Fields |
Description |
|
|
The System View is the default system-defined View displaying a specific set of defined column fields in the grid. When you click on the System, it displays the list of all three Views - My View (created by you), System View, and Public View (views created by other you). The application displays the System View by default if no other views are created or selected. |
|
|
The Configure View icon provided in the top right corner helps you to customize the layout of the screen to view the information as per their requirement. By default, the display of the data is set to System View with predefined columns. To view particular columns, which are not included in the system view, you can add those required columns in the layout using the customize plugin option. |
|
|
The function of the Reset icon is to clear all the filters applied on the Reports page. |
|
|
The Nine dots icon is enabled on the top right corner, which helps you to perform multiple actions on the selected Reports. |
|
|
The filter icon helps you to apply filters to view selected options related to search results. The search icon is configured on the columns, to search for the required result. You can also apply conditions during the search operation, using the You can sort the Connection Name, Report Group, Report Name, Title, Type, Tags, Last Modified Date, Created By, Popularity, Importance Score and Certification type using the sorting option. |
|
Connector Name |
Displays the Database connection name available within the OvalEdge application, containing the reports. Example: The databases available in the OvalEdge application containing reports, such as Tableau, Power BI, etc., are displayed here. |
|
Report Group |
Displays the name of the Report Group to which the report belongs. |
|
Report Name |
Displays the report name, which is defined at the source. Note: The Report Name field is not editable. An eye icon is available in the Report Name column to provide a quick view of the report. |
|
Title |
Displays the title of the Report. The title is an editable field. When you hover over a specific title it will display the edit icon on the Title Column. You can click on the Edit icon to edit and click the Save button to save. |
|
Column Type |
Displays the type of reports such as Barchart, Tile, Dashboard etc. |
|
Project Name/ Acess Cart |
The projects associated with the data object are displayed in this column. A Checked icon is displayed if the Database is added to the default project. Hover over the Checked icon to view the Project name. Click on the Add to Default Project icon to add the schema to the default project. Note: If My access cart is selected as the default project, then the label name will be will be changed from Project to Access Cart, and you can raise an access request using the access cart icon. |
|
Tags |
Display the Tags associated with the Report. The Tags field is editable; hover over a specific tag field to see an edit icon. Click the edit icon to edit and assign tags to the Reports. |
|
Terms |
Display the Term associated with the Report. The Terms field is editable; hover over a specific tag field to see an edit icon. Click the edit icon to edit and assign or remove tags to the Reports. |
|
Business Description |
Displays the Business Description of the report. It is editable; hover over a Business Description field of a specific report, and click on the edit icon to edit the description. Note: Users with Meta-write access can only edit the Business Descriptions. |
|
Technical Description |
Displays the technical parameters or comments defined at the data source. It is editable, hover over the Technical Description field of a report and click on the edit icon to edit the description. |
|
Last Modified date |
Displays the date when the report was modified recently. |
|
Created by |
Displays the user who has crawled the Database. |
|
Popularity |
Displays the popularity score of the report. |
|
Importance |
Displays the Importance score of the report. |
|
Path |
Displays the location of the report on the source. |
|
Owner |
Displays the name of the Owner of the report. |
|
Steward |
Displays the name of the Steward of the report. |
|
Custodian |
Displays the name of the Custodian of the report. |
|
Certification |
Displays the Certification type applied to the report. Example: Certify/Caution/Violation/Inactive/None. |
User Actions
The following are the User Actions that can be performed on the Report using the Nine dots option
|
Icons/Fields |
Description |
|
Add to my watchlist |
You can add the selected report to my watchlist using this option. |
|
Remove from my watchlist |
You can remove the report which is added to my watchlist using this option. |
|
Add Tag |
You can add tags to one/ more reports using this option. |
|
Remove Tag |
You can remove tags added to single/ multiple reports using this option. |
|
Add Term |
You can add terms to single/ multiple reports using this feature. |
|
Remove Term |
You can remove the Terms added to single/ multiple reports using this feature. |
|
Add to default project |
You can associate the selected reports with the default project using this option. |
|
Service Desk |
You can raise an access request for the selected Reports using this feature. |
|
Remove from Default Project |
The associated default project can be removed from the data objects by using this feature. |
|
Update Governance Roles |
You can add governance roles such as Steward, Custodian, and Owner to the selected data objects using this feature. |
|
Change Certification Type |
You can change the type of certification applied to the data object using this feature. |
|
Add Reports to impact analysis |
You can add the reports to any of the Impact Analysis available in the application, to view the impact of the selected report. |
|
Quick Tips |
It gives a few insights on the Reports objects. |
When you select a Report, it will navigate to the Report detailed page. The report detailed page is further divided into Summary, Lineage, References, and Column details.
Report Summary
The report Summary displays all the meta-data information of a specific Report. It includes descriptive information about the data such as Report Title, Business Description, Technical description, the associated Terms, tags, column count, Type of Report Group, etc.
The metadata information includes descriptive information about Business Description, Technical description, Tags and Terms, Certification details, current owner, etc. Meta-data information for a report is shown when the associated data object is crawled on the Administration > Crawler page.
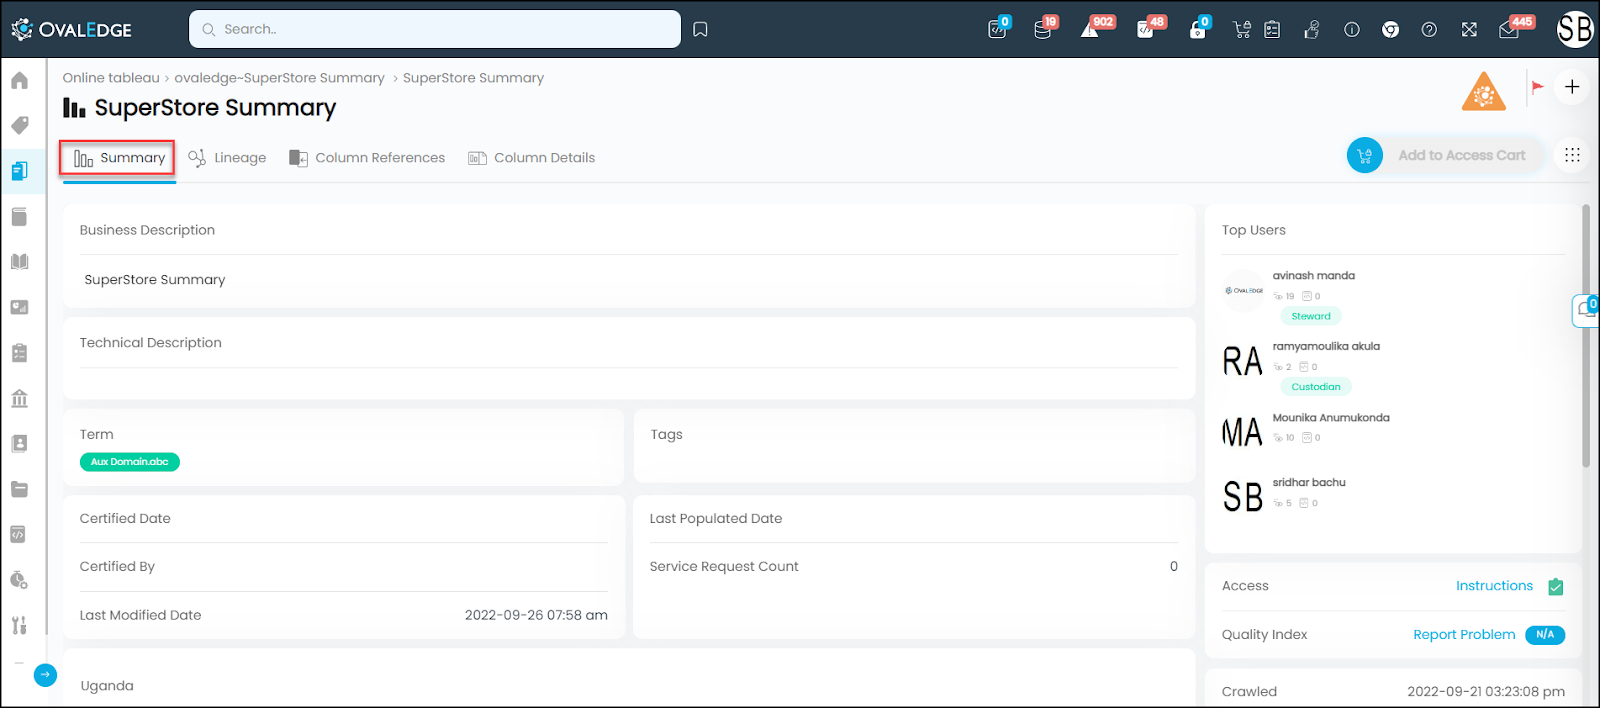
The report summary provides the information of a report as follows:
- Certified Date: It displays the Date & Time on which the certification (Certified / Violation / Caution/ Inactive status ) is applied to the report.
- Certified By: It displays the User name who has certified the report.
- Last Modified Date: It displays the Date and Time on which the last modifications are made to the report in the source system.
- Last Populated Date: It displays the date on which the APIs are created and updated in the OvalEdge Application.
- Service Request Count: It displays the total number of service requests raised on the report.
- Access Instructions: The access instructions provided in the crawler setting page to the reporting database are displayed against the access instructions.
- Quality Index: The quality Index is the Data Quality score of a report based on the status and age factor of the rule last run time and ticket resolved date.
- Last Crawled date: It displays the latest date on which the database is crawled to the application.
- Type: It displays the type of the report. (workbook/view/dashboard/bar chart etc)
- Column count: It displays the number of columns available in the report.
Report Summary User Actions
The following are the User Actions that can be performed on the Report using the Nine dots option
|
Icons/Fields |
Description |
|
Process upstream/ downstream objects |
This option helps to certify the downstream data objects as a caution, remove caution from the downstream, and to copy the metadata of the upstream/downstream objects of the select Report. |
|
Add to my watchlist |
You can add the Report to my watchlist using this option. |
|
Send messages |
This option helps to send messages to the owner, steward, and top users of the downstream data objects of the report. Note: The send message option will be enabled in case of the availability of the downstream objects for the report. |
|
Service Desk |
You can raise an access request, content change request, and Data Quality Issue request on the selected report using this option. |
|
Add to Impact Analysis |
You can add the selected report to impact analysis using this feature. |
|
Apply Certification |
You can certify the reports by using this Nine dots feature. |
|
Configure Search Keywords |
You can configure keywords to search the data object. |
Add to Default Project
The add to default project option allows you to add the report to the default project.
To add a data object to the default project:
- Click on the Data Object to navigate to the Object summary page.
- Click on the Add to Project button, to display the Add to Project pop-up window.
- On the Select Project Field, you can view the Default Project Name.
Note: An edit icon is enabled on the Select Project Field, to change the default project. Click on the Edit icon to view the Projects available within the application. Select the Project you want to add the data object and enable the check box to make the project default. - Enter the text on the Task Notes, if any.
- Click on the Add to Project button, to add the data object to the default project.
Report Lineage
Report Lineage is a visual representation of data movement from source to destination. Report lineage displays the origin of the data, describes the path, and shows how it reaches the target and all the transformations it undergoes in its lifecycle. It provides the ability to track, understand, record, and visualize the data transformation, and the impact of the report on other objects. Any transformation codes responsible for the data movement are also captured and displayed within OvalEdge Lineage.
The Report Lineage helps to:
- Discover errors in data processes by validating the accuracy and consistency of the data.
- Analyze impacts
- Perform root cause analysis on low-quality data.
- Helps you to make strategic decisions using accurate information and perform system migrations effectively.

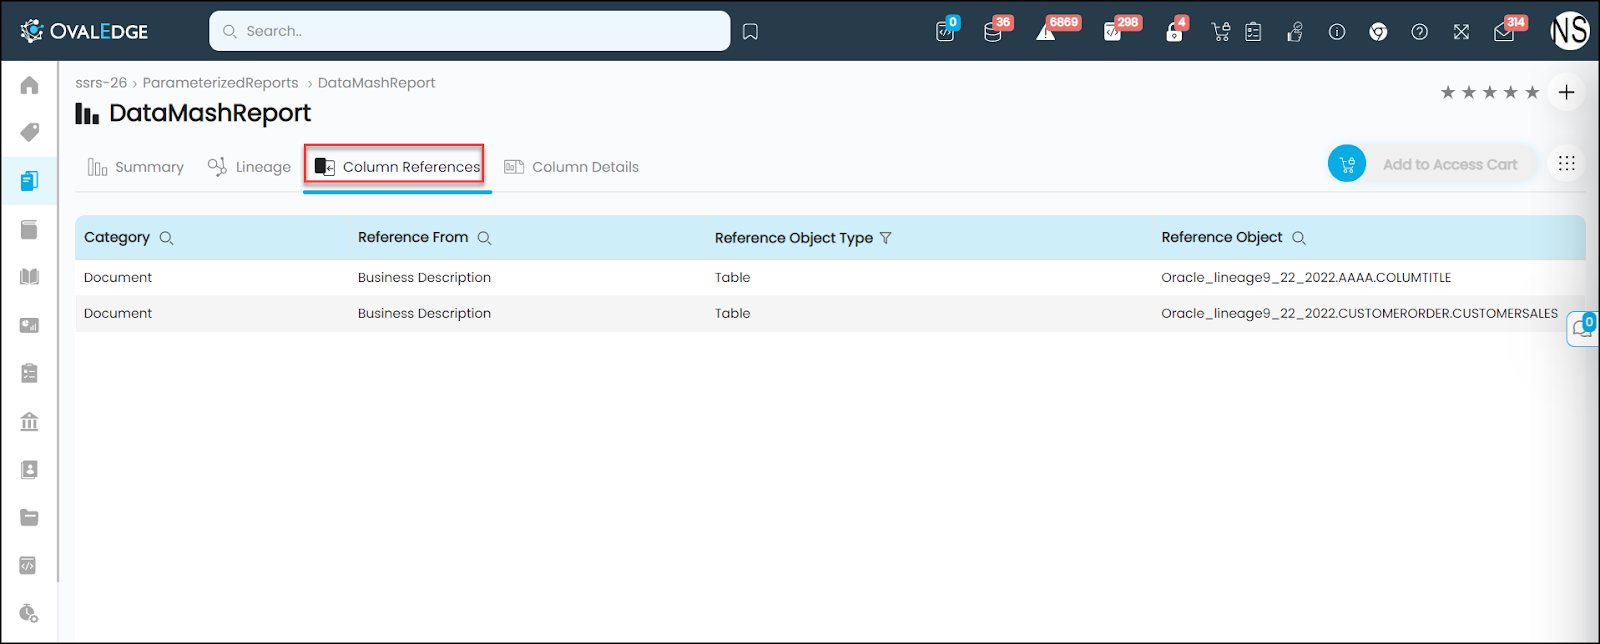
Report References
Reference objects contain a specific set of information to be used by other data objects in the application.
Report references provide a list of all references made from a Report to other data objects in the application. References can be made to Business Glossary/Projects/Tables/Table Columns/ Files/File columns/ Reports/Report columns/ Data Stories/Queries/.
Objects can be referenced or linked to other data assets using the @ notation where the text field editor exists in the application. Business Description text field, endorsement rating text field, and Terms field are a few text fields from which the data objects can be referred.
To create references to other data objects from a Table, you need a text field like Business description, Technical Description field, or endorsement rating to refer to the objects.
- In the Text field enter the @ notation to see a drop-down displaying the different data assets to which the Table can be referred.
- Select the data object or item you wish to refer to using the search filter drop-down options for which pertaining additional drop-down options are listed to select the object.
- Upon selection, the objects get referred to the Table.
- You can see the Table details in the referred objects > Reference.
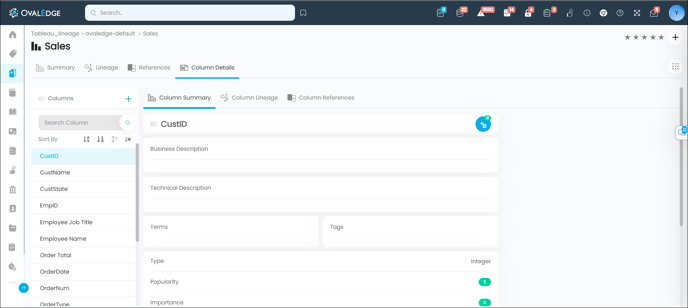
Report Column Details
The Report column details display the list of columns available in the report in the left panel to understand statistics, relationships, and column-level lineage for the Report Columns.
The Table Columns detailed page is further divided into different sections:
- Column Summary - The metadata details and Formula (applied to generate the report) of the Report Columns are displayed.
- Column Lineage - It displays lineage flow between a specific report Column to other linked data object columns in the application. The Column Lineage is shown using the source objects and destination objects to drill down deep into data assets to view summary and query codes.
- Column References - Column references provide a list of all references made from a report column to other data objects in the application.
To add a report column:
- Navigate to Data Catalog > Reports > Column Details Page.
- Click on the + icon, which will display Add Column Pop-up.
- Enter the column name in the required field.
- Click on the Add column, to add the column.
Note: A search bar is available on the report column to search the required report columns.
Copyright © 2019, OvalEdge LLC, Peachtree Corners GA USA