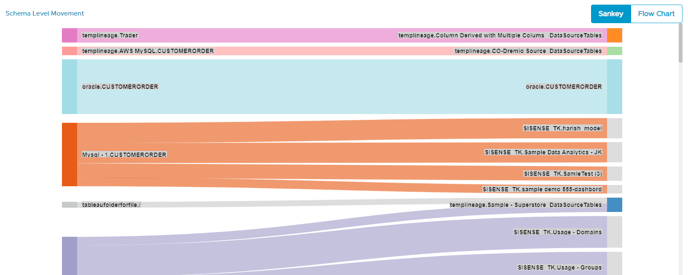
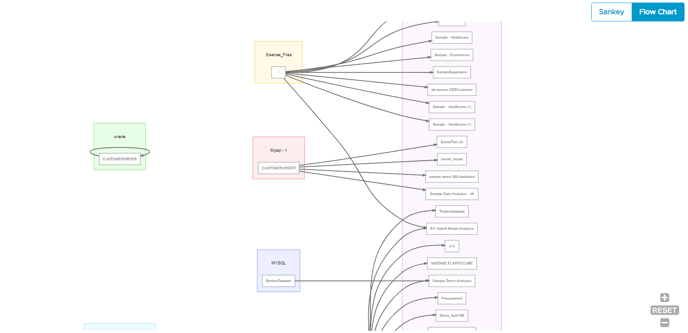
In the OvalEdge the existing Lineage Graph is enhanced to provide a clutter-free view. Apart from the existing viewing capabilities, viewing Data Lineage graphs have become more user-friendly. The Lineage is represented in the Sankey diagram and Flowchart diagram.
To view the data lineage in the Sankey diagram,
- Navigate to the Dashboard module
- Click on the Data Lineage. By default, the Sankey diagram is displayed.
- Zoom in Zoom out: For more readability and visualizing, users can now zoom in and zoom out in the lineage graph and are capable of having the closure and clear visuals of the lineage graph.
- Dragging: This feature is enabled in place of the horizontal and vertical scroll bars. Here the users can easily drag into the lineage dashboard as per the needs.
- 3 Dots: The contextual menu associated with each object is provided with many more options to perform in the data lineage graph. Here the user can click on the 3 dots to,
- Copy to clipboard: It is to copy the object name with connection and schema name
- View Association: It is used to view the dataset of a query, however, it is disabled for objects.
- Correct the lineage: It is used to show If any lineage is not correctly built
- Report Missing Lineage: It is used to notify missing lineage using the service request missing object using object id.
To view the data lineage in the Flowchart diagram,
- Navigate to the Dashboard module
- Click on the Data Lineage. By default, the Sankey diagram is displayed.
- Click on the Flowchart tab.
+RESET-: To make the page bigger or smaller using + RESET-.