Access
The instructions added to the Access Instructions while crawling a connection in the Administration > Crawler > Nine Dots > settings > Access Instructions text field - is displayed in the Access field. Click on the Instructions button to view the details added.
Add to Projects
The Add to Projects button helps you to add data object to a selected project or default project.
When you click on the Add to Project button, a pop-up window is displayed with the Linked projects (if any) associated with the object. Here You can select the project to which you wish to associate the data object with from the drop-down. However, a Default project icon is enabled in the header to set the Default Project.
You can also add additional notes in the field provided. Click on the Add to Project button, the selected Parent Story will be added to the Default Project and a Success message “Added To Project <Default Project Name> successfully” is displayed. You can now select the Add to My Cart Project as a default project to add the data objects to My Access Cart and raise multiple Service Request in a single click.
Additional Fields
Additional Fields also referred to as custom fields allow you to add additional metadata information about the Table). The additional custom fields (Text/Code/Number/Date) created in Administration > Custom Fields are reflected in the Tables summary page.
Business Description
A business description provides a clear understanding of the data objects (Tables/Files/Reports) and their function. It is descriptive information of the data object and its fields that will be helpful for business users. By default the description box is empty, and the user can update it accordingly.
The Business description field is editable. When you click on the edit icon text field becomes editable which helps you to edit/update the Business description. You can include images, links, videos, or tables, apply basic formatting to the text, and also add object references using @ annotation.
Note: Users with Meta-write access can only edit the Business Descriptions.
A History button is enabled next to the Business Description icon to view all the logs of changes made to the Business Description with an easy download option.
Certified Date
It displays the Date & Time on which the certification (Certified / Violation / Caution/ Inactive status ) is applied to the data object.
Certified By
It displays the name of the user who certified the data object.
Classifications
The classifications associated with the Term are displayed in this field.
Configure View
The Configure View icon is enabled in the top right corner to help self-customize the columns you wish to view on the Data Catalog objects page. Click on the Configure View button, and a pop-up with add/remove column fields is displayed.
Configuring a view
The Data Catalog page by default is set to display System View with predefined columns.
- Click on the Configure View icon placed in the top right corner, a pop-up is displayed.
- You can multi-select the fields and options you wish to see in the Data Catalog Tables main grid.
- Select a connection from the drop-down list for which relevant additional fields are displayed. Based on connections selected the related custom fields are displayed under the Select fields list. There is a provision given to search the fields using the Search Fields.
- You can select the field columns which need to be viewed in the Data Catalog main table page grid.
- The fields highlighted in gray are predefined fields and cannot be deselected.
- The fields with the
Wait icons display the impact on the performance of loading the fields.
- The selected connection and field options are now displayed in the Order Fields panel. You can click and drag the fields up/down to keep the priority fields at the top which are accordingly displayed first in the Table main page grid.
- You can now Save View the customized view by entering the mandatory fields with an asterisk in red.
- Enter the Name of the View in the field provided. The Name of the view should be unique to save.
- Add a Description for the view in the field provided to give an idea about the created view for future reference.
- You can set the Page Size to any number from the drop-down options to view a specific number of objects per page.
- Set the view to Default to apply the created view as a default view.
- Set the view to Visible to all (Public View) to make the view visible to all public users visiting the page. Unselect to keep the view Private where other users cannot view the View created.
Note: If no view is selected or present the System View is by default selected. - Click on the Save button to update any changes made to the existing view.
- Click on the Save as New button to save the newly created view with a new name.
- The newly created View is saved to the list of views and is applied to the page if it is selected as default.
- All the selected and sorted columns are displayed. The columns now support a multiple-sorting feature, where sorting a specific column order from A-Z/Z-A does not impact other column orders.
Download the database Table to an excel sheet
To download all the tables and columns within each table and their descriptions in one go, click on theDownload icon placed in the bottom right corner of the page.
Column count
The Column Count displays the total number of table columns existing in the selected data object.
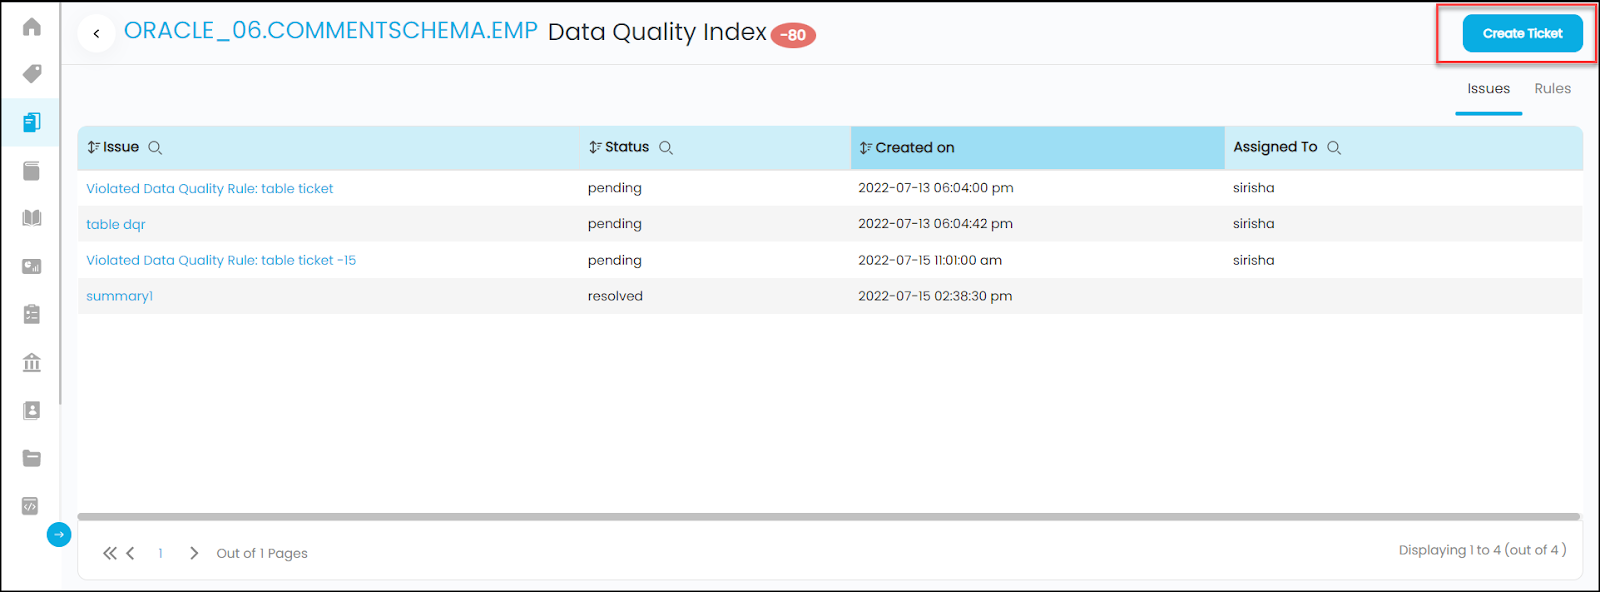
Data Quality Index
The Data Quality index gives an overall idea about the quality of the Table object based on the Service Tickets raised and resolved. If there are multiple issues that are not resolved, this signifies that data quality is poor.
- The value increases/ decreases based on the tickets Service raised and resolved.
- -10 -> When a ticket is created.
- +20 -> When a ticket is resolved.
- +30 -> When a Rule is a Success
- -20 -> When a Rule is failed
- Data Catalog > Tables > Summary Page > Data Quality index field. Click on Quality Index to navigate to the Quality Index page.
- Initially, the Data Quality Index for a Table object will be zero and this is represented as N/A when there are no issues reported or rules added to this.
- Click on the Create Ticket button enabled in the top right of the screen to raise a Data Quality Issue request. When the ticket is submitted the quality index score is changed to -10.
- The Issues tab displays the data quality issue reported through the service desk, the Quality score, Status, Created and Assigned to details in the grid.
- The Rules Tab displays rules that are violated in the Data Quality Rule module where the Dimension, Rule Type, Last Run Status, and Date & Time are displayed in the grid.
Density
Density indicates the degree to which a property is filled with duplicate values. It is a measure of the lack of uniqueness of the data in an object. If the density is high then the object has a high number of duplicates.
Endorsement Rating
An Endorsement Rating is a great way to share the integrity of a data object with other users. You can provide different degrees of endorsement to each data object in the following ways:
- Star rating: Based on the data quality and integrity a rating is given to an object out of 5 stars. If 5 stars rating is given, the data object gets highly reliable and trustworthy. If 1 star rating is given the data object is considered average.
- Raise a Flag: A red flag is a warning given to notify other users suggesting that there is a potential issue with the data quality of the data object. If you raise a red flag on a specific data object, the data moving downstream to any tables, files, and reports will be marked with a red flag. The red flag helps other users aware of the issue.
You can also enter an endorsement message in the provided space for reference.
Note: Users with Meta write access can edit/update the endorsement.
Historic row count
A bar graph displays the logs of rows in a table changing over a period every time the data is profiled. To identify any data changes over a period, click the Historic Row button to navigate to the Compare Profile Results page. When you hover over each bar, you get the count of the number of rows in that table for each profiled date. The current and previously profiled values are compared and displayed separately in different columns. Additionally, the Profiled Date, Row Count, Popularity, and Importance scores are compared and displayed.
Importance Score
Importance score shows how vital a Table object is across the database based on the number of relationships and the lineage (downstream objects) associated with the Table.
The Importance score is calculated based on the below formula:
Formula: Importance score = [200 X no. of rows in the Table/Max row count in schema no. of columns X (0.1)] or - [no of downstream X 7] or - [PK or FK X 3].
Example: In a Database having 5 tables (table A, table B, table C, table D, table E), if TABLE A has matching fields with the other 4 tables, then the importance score for TABLE A is high.
These scores are displayed in the data catalog as soon as the data objects (Tables) are fully profiled. The score increases as the data lineage, and new relationships are added manually.
Key
It displays the Primary Key/Foreign Key associated with the Table column. If columns are not associated with any Primary Key or Foreign Key it just displays as blank.
Dates
- Crawled Date
The Crawled Date field displays the latest Date & Time on which the object is crawled. If this field is empty, you can identify that the Table object is not crawled. If a data object is crawled on a daily basis lets say on 1/1/2022, 2/2/2022 & 3/3/2022 then the last Crawled Date 3/3/2022 will be displayed in the field. - Profiled Date
The Profiled Date field displays the latest date and time when the object is Profiled. If this field is empty, you can identify that the Table object is not profiled. If a data object is on 3/3/2022 then the last profiled date 3/3/2022 will be displayed in the field. - Last Meta Sync Date
It displays the date on which last metadata changes are made to a data object. Crawling updates the latest metadata changes of the data object.
For Example: If a Table Business Description is changed on 4/1/2022 and is crawled on 5/1/2022 then the Last Meta Sync Date is displayed as 5/1/2022 as the metadata changes are updated only after crawling is done. However, if the same data object is crawled again on 8/1/2022 with no metadata changes made to the Table, then the Crawled Date gets updated as 8/1/2022 and Last Meta Synch Date displays 5/1/2022. - Last Updated Date/Last Modified Date
It displays the Date & Time on which the last modifications are made to the data object records or data.
For Example: If a single record of a Table data is changed on 9/1/2022 and is crawled on 10/1/2022 then the Last Updated Date is displayed as 10/1/2022 as any data changes made to a data object are updated only after crawling is done. However, if the same data object is crawled again on 12/1/2022 with no data record changes made to the Table, then the Last Updated Date gets updated as 12/1/2022 and Last Updated Date displays 10/1/2022. - Last Populated Date
It displays the last populated date and time.(No information on this) - Certified Date
It displays the Date & Time on which the certification (Certified / Violation / Caution/ Inactive status ) is applied to the data object.
List of Views
The List of Views displays the default System view and customized views in a list mentioned below:
- My View- It shows the list of views created by you.
- System View- It is the system-defined view. The system view is by default displayed if no other default view is created or selected. The system view cannot be deleted.
- Public View- It displays all the different Views created by other users in the application. The Public Views can only be deleted by the creator.
Length of a field
The length of the table column defined in the remote database is displayed.
Maximum Values
It displays the maximum value from all the records in the table. The Maximum Values are extremely useful to find the largest value from rows in a column i.e., highest paid employee, highest selling product, or most expensive product that helps in taking business decisions. The value displays NULL if the Table has no rows.
Metadata
Metadata is data about data that helps identify and locate data objects.
Example: The metadata of a digital image includes details such as the size, resolution, color depth, when it is created, shutter speed, and other details of the image but not the image.
Null Density
Null values are unknown values that represent a missing or blank field. It is important to understand that a Null value is different from a zero value. The Null Density indicates the aggregated percentage of rows that contain a null value when compared to the cardinality of the table.
(Cardinality of a table= Number of Columns in that table*Number of Rows in that table)
In an ideal situation, the null density should be 0%. Anything other than 0% indicates the percentage of null values in the table.
Null Value
Null values represent a missing or blank field. It is important to understand that a Null value is different.
Nullable
When Table columns are crawled, there is an added functionality provided to define whether the particular Table column as Null - True or False.
- If set to False - a Table column can never have blank cells.
- If set to True - a Table column can have empty field values.
Popularity Score
The Popularity Score displays the number of times the users interacted with this data object by viewing, endorsing, commenting, adding tags, or by querying the data object.
The total number of view counts shows how popular the data asset is relative to other assets in the application. The more the popularity score, the more the data asset gets popular for recommendations. Popularity score helps make informed decisions using real-time metrics.
Popularity scores are calculated based on the following actions:
- Views a data object (table/table column/file/Report) - the score improves by 1.
- Endorses a data object - the score improves by rating.
- Assigns a red flag - the score decreases by 10.
- Comments on a data object - the score improves by 5.
- Change the Wiki of an object - the score improves by 3.
- Tags a data object - the score improves by 4.
- Queries a data object - the score improves by 3.
Row count
The Row Count displays the total number of records (rows) in the selected data object.
Service Request Count
It displays the count of total service requests made on the Table to Request Content Change / Request Access / Report Data Quality.
Status of data objects
Crawling and Profiling the data sources forms a foundation step to data discovery and data cataloging. As Crawling brings in the metadata information and profiling computes statistics of your data within OvalEdge, it is always important to schedule these tasks periodically.
- Crawling is used to extract large-scale data from remote sources. It gathers all the metadata details such as Schemas, Tables, Table Columns, View, View source code, Relationships, and Comments of the data assets for data analysis.
Example: If a SQL database is crawled, all the data assets in the remote source are extracted to the OvalEdge application.
- Profiling is the process of connecting to a data source to gather statistical information about a data object. Example: Once crawling is done, a Table can be profiled to view the statistics of the total number of Table columns present in the table, the null count, distinct count, and other parameters.
The Status field displays the profiling state of the Table data object.
- Profiled - When full profiling is complete on the data object.
- NULL/Not Profiled - When the data object is not profiled.
- Sample Profiled - When sample profiling is conducted and completed on the data object.
- Partially Profiled - When the data object is Partially profiled.
- Profile Failed - When the profiling fails.
In the OvalEdge data catalog module, the latest crawling and profiling dates are displayed on the summary page of each data object.
Table Type
Type displays the Table type - whether the Data Object is Empty/Table/View/API type.
Tags
Tags are search keywords applied to data objects to improve data search and quick discovery of related data objects from the database. You can label a data object using Tags to group objects together to give more control and power to search within the application. Tags are added to data objects like Databases / Tables /Table Columns, Files / File Columns, Reports, Report Columns, Business Glossary, Data Stories, and Queries.
Each data object can have a single tag or multiple tags applied to them. Also, each tag can have multiple data objects associated with it.
To add Tags to the data object(s) using Nine Dots
- Go to the Data Catalog > data object type (Tables, Files, Reports) > select the data object(s) on which you want to add a Tag.
- Click on the Nine Dots icon to select the Add Tag option. An Add Tag pop-up with the Tags in the drop-down is displayed.
- Click on the + icon against the selected Tag to add the Tag to the data object(s).
Add Tag using Edit icon in Data Object Main Page:
- In the Data Object Main Page, click on the edit icon present in the Tag column against the data object. An Add Tag pop-up is displayed to select the Tag from the drop-down list.
- An Add Tag pop-up window displays the Tags in the drop-down.
- Click the + icon against the selected Tag to add the Tag to the data object(s).
Note:
- You can add/edit tags from the Data Object Summary Page > Tags field.
- To create a tag, you can go to the Tag module > Click the icon. Enter the Tag Name you want to apply for the Data Objects, then click save.
- To create new tags, a user role must have OE_ADMIN access. The User with meta-write access can associate data objects to the tags, and the user having meta-read access can only view the existing tags.
To remove Tags from data objects,
- Go to Data Catalog > Data Object Type > select a data object for which you want to remove tags.
- Click on the Nine Dots icon to select Remove Tag.A Remove Tag pop-up with the previously assigned tags is displayed.
- Click on the – Minus icon to remove the Tag.
Technical Description
It displays the technical parameters of a data object. When a data object is created by default the comment field is facilitated for the developers to provide additional details about the data object. The comments provided at the source are fetched and displayed in the Technical Description field once crawling is done. Example: Details about the primary key, foreign key, field data type, and calculations are a few of the technical parameters included in the Technical Description.
You can edit/update the Technical description using the edit icon to include images, links, videos, or tables, and apply font styles.
Note: Users with Meta-write access can only edit the Technical Descriptions.
A History button is enabled next to the Technical Description icon to help view all the logs of changes made to the Technical description with an easy download option.
Terms
Terms are the unique and standard definitions used within an organization. A Term adds a business context to the data present at the enterprise level. Terms are applied to business domains used across an organization to reduce miscommunications and improve data-sharing. You can also organize terms by adding a tag to the term for easy navigation. The Terms can be associated with different data objects in the application to identify, locate and classify object(s) easily.
A single Term can be applied to multiple data objects in the application. However, a data object can have only one Primary Term and multiple auxiliary Terms applied to it.
A Term cannot be applied to objects with DAG tags.
To add a term to multiple data objects using Nine Dots,
- Go to the Data Catalog > Data Objects (Tables, Files, and Reports) > select the Data Object(s) on which you want to add a Term.
- Click on the Nine Dots icon to select Add Term option.An Add Term pop-up window with the Terms in the drop-down is displayed
- Click on the + icon against the selected Term to add the Term to the data object(s).
- You can also Suggest a Term (create a new Term) from this pop-up.
Note: In the main grid, hover on to a Term to see an edit icon. Click on the edit icon to add a New Term or remove an assigned Term.
To add a Term to a selected data object,
- Go to the Data Catalog > Data Objects (Tables, Files, and Reports) > Detailed Object Page.
- Click the +icon in the Term field. An Add Term pop-up window with the Terms in the drop-down is displayed.
- Click on the + icon against the selected Term to add the Term to the data object(s).
- You can also Suggest a Term (create a new Term) from this pop-up.
To remove Terms from data objects,
- Go to the Data catalog, and select the desired table object(s).
- Upon selection, click on the Nine Dots icon to see the Remove Term option. A pop-up with the Assigned Term is displayed.
- Click on the - icon to remove the Term.
Note: A Term can be removed from any Add Tag pop-up window by clicking on the - icon against the term in the Assigned Terms panel.
Top Values
It displays the top 50 records (rows) of a Table column and also displays the Count value based on how many times the record is repeated in the column.
Top Users
Tops users are the most active users who have viewed, commented, and collaborated with the data assets, and their scores are determined based on their roles and permissions.
Values
OvalEdge provides a list of standard fields like minimum / maximum count, density, null density, distinct count etc. This section displays the minimum and maximum values of each column.
Minimum Value
It displays the minimum value from all the records in the table. The Minimum Values are extremely useful to find the smallest value from rows in a column, i.e., least paid employee, low selling product, or least expensive product that helps in making business decisions. The value displays NULL if the Table has no rows.
Copyright © 2019, OvalEdge LLC, Peachtree Corners GA USA