Overview
The Compare Schema and Compare Profile tools in OvalEdge are powerful features that facilitate a comprehensive analysis of changes in metadata and profiled data over different periods of time or instances.
The Compare Schema tool allows users to examine alterations in database schemas, such as additions, modifications, or deletions, providing valuable insights into the evolution of data structures.
The Compare Profile Results tool enables users to assess changes in data profiling metrics, offering a detailed view of modifications in data characteristics and distributions over time.
These tools are accessible through the Advanced Tools section in OvalEdge and empower users to make informed decisions about their data management strategies. By leveraging the Compare Schema and Compare Profile Results functionalities, users gain a deeper understanding of how the data sources have transformed over time, supporting impact analysis and ensuring data integrity within the OvalEdge platform.
Compare Schema
What is schema comparison?
Compare Schema is a schema comparison tool to find the differences between two database schemas or the same schema at different points in time. Users can review the number of differences by the table column count. It is an analysis of the attributes of tables or columns that have been modified over a certain period of time. The comparison results display the analysis of new metadata changes (table names and column counts) between the compared dates. The schema comparison result appears in tabular format.
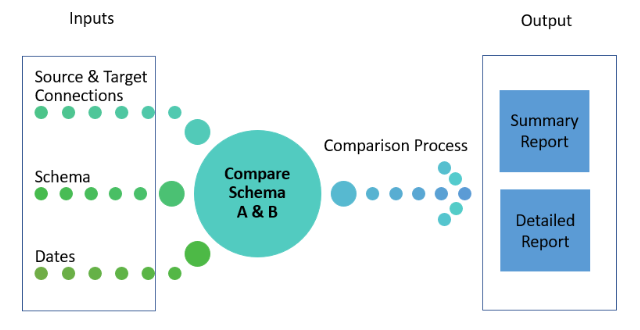
Schema compare allows users to compare schemas in order to highlight the physical differences of the tables and fields across multiple points in time (e.g., The production system today vs. yesterday), across source systems or across environments (e.g., UAT vs Production).
Uses of schema comparison
Schema compare is useful in the following instances:
- During the development process or application upgrades to compare different production environments, such as production and staging.
- To compare the schema of different databases across server environments to ensure consistency.
- As an auditable trail of changes made over time by comparing the same database at different points in time.
In the world of data management, comparing schemas from different time periods is vital for making informed decisions. OvalEdge has a Schema Comparison tool that makes it easy to analyze schemas and understand how data changes over time.
Schema Comparison Basics
OvalEdge's Schema Comparison tool lets users compare two schemas with the same name at different points in time or two different schemas without dates (compares the most recent crawl job results). By doing this, users can better understand how the data changes over time, find any irregularities, and make sure the data is accurate.
Navigating Compare Schema
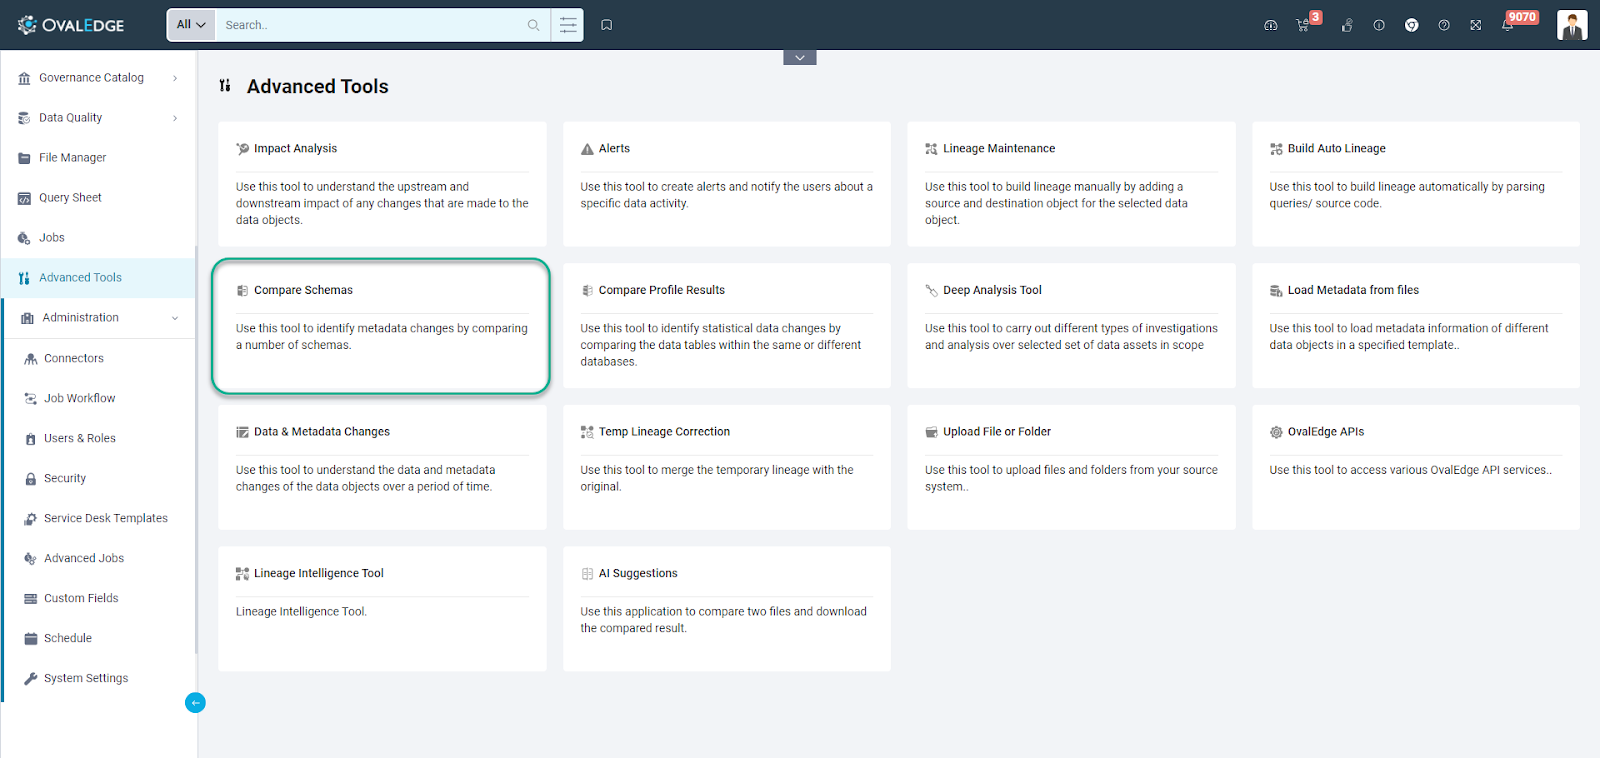
Users can access the Compare Schema module in OvalEdge by clicking on the Advanced Tools tab, provided they have the necessary permissions, i.e., Author user with Metadata Write permission. Within Advanced Tools, the Compare Schema tab is available, allowing users to seamlessly navigate to this module.
Providing Input for comparison
A. Comparing Same Schema
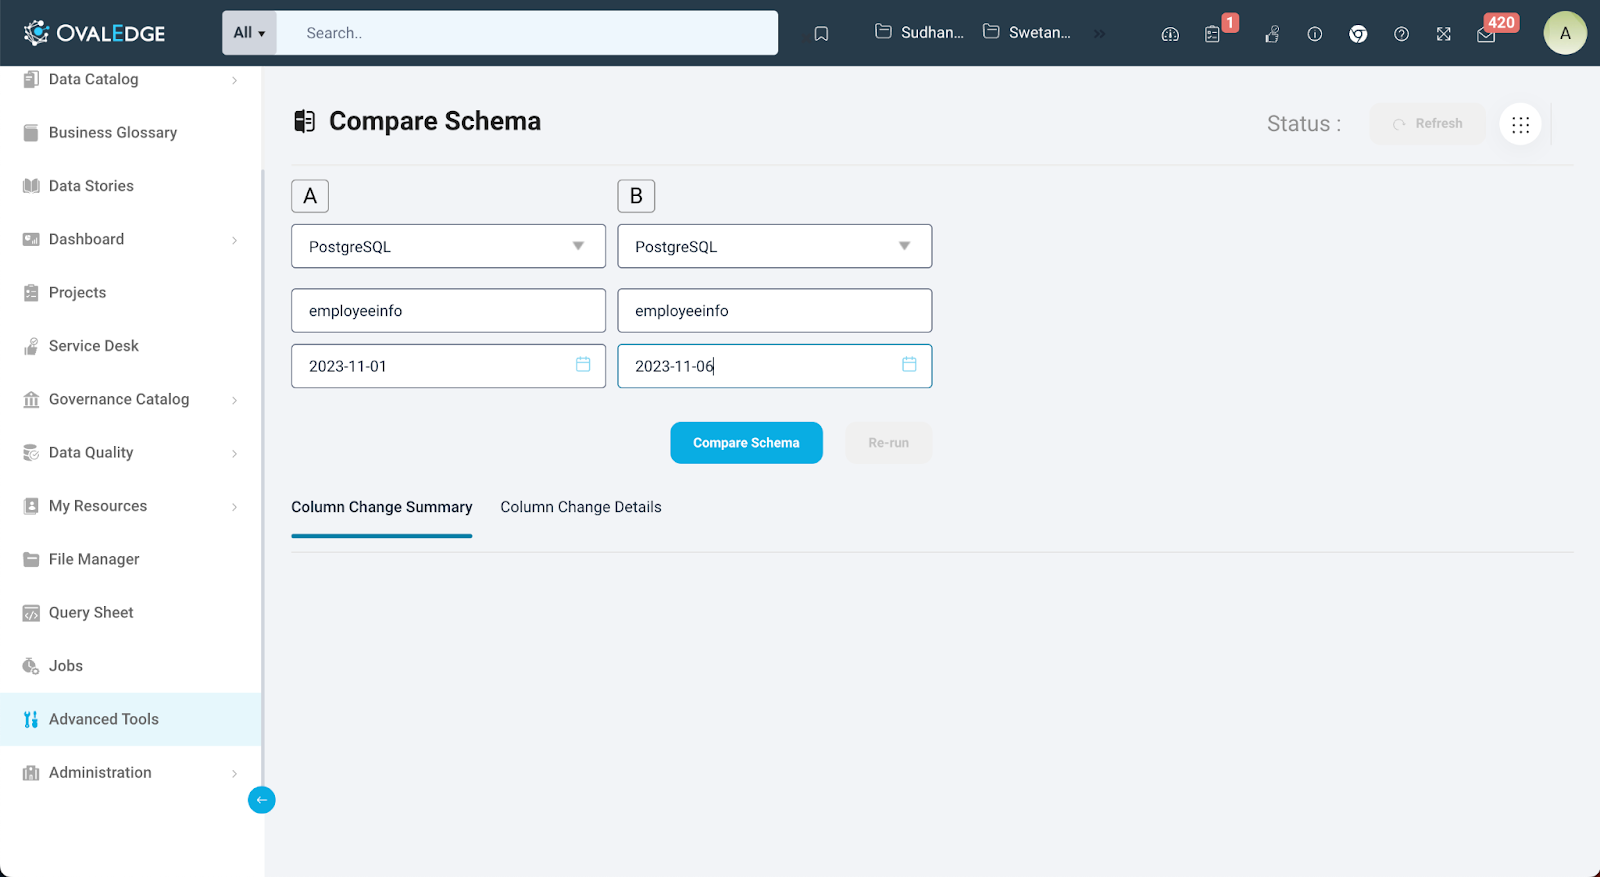
To use schema comparison, users are required to input specific details that guide the comparison process. These details include:
- Connector A:
-
- Schema A: Following the selection of Connector A, users must pinpoint the specific schema within this connector that they wish to compare. This choice forms the core of the schema analysis.
- Connector B: The Schema Comparison module also necessitates the selection of Connector B, where the second schema to be compared is situated. Connector B should also be the same as Connector A in enabling the comparison of the same schema.
- Schema B: In parallel with Schema A, users must select the corresponding schema within Connector B that they intend to compare. This pairing ensures a comprehensive analysis of schema transformations. Both schemas should be the same.
- Date for Schema A: Users must input the starting date for Schema A. This timestamp establishes the beginning of the time period under scrutiny, allowing for a precise and targeted comparison.
- Date for Schema B: The completion of the comparison framework involves the input of the date for Schema B. This date acts as the culmination point of the time interval under examination.
B. Comparing Different Schemas
To perform schema comparisons across connectors, users are required to provide specific input details to guide the comparison process effectively. Here's a breakdown of the key input fields:
- Connector A: Users initiate the schema comparison by selecting the name of the connector where the first schema of interest resides. This acts as the reference point for the comparison.
- Schema A: Next, users pinpoint the specific schema they wish to compare within Connector A. This selection establishes the foundation for analyzing schema changes.
- Connector B: In parallel, users also need to identify the connector where the second schema, which they intend to compare, is located. This connector serves as the point of reference for the second schema.
- Schema B: Users are prompted to select the schema from Connector B that they wish to compare. This completes the framework for a comprehensive schema analysis.
After inputting all the details, users can initiate the comparison job by clicking on the ‘Compare Schema’ button.
By filling in these input fields, users can initiate schema comparisons within OvalEdge, providing valuable insights into data changes, historical trends, and potential discrepancies. This feature is particularly useful for data professionals seeking to ensure data quality and consistency while making informed data-related decisions.
Adding Tables / Columns to Impact Analysis
Impact analysis is a key part of data management, helping users understand what happens when schema content changes. The OvalEdge application has various options to strengthen impact analysis by bringing in tables and columns from Schema Comparison results.
Empowering Impact Analysis through Schema Comparison
OvalEdge gives users the freedom to broaden the reach of impact analysis by including tables and columns from schema comparison results (using the 9 Dots menu options). This integration allows data experts to grasp the wide-ranging effects of schema changes. Here are the ways users can enhance impact analysis in OvalEdge:
1) Add Deleted Tables to Impact Analysis
This option allows users to seamlessly introduce deleted tables into an impact analysis, based on the results obtained from the schema comparison. By including deleted tables, users gain insights into the repercussions of their removal, helping to make informed data-related decisions.
2) Add Deleted Columns to Impact Analysis
With this feature, OvalEdge enables users to include deleted columns in an impact analysis. These columns, which have been removed over time, can significantly impact data processes. By adding them to an impact analysis, users can comprehensively assess the effects of their absence.
3) Add Changed Columns to Impact Analysis
OvalEdge extends the capability to add changed columns to an impact analysis, leveraging the results obtained from schema comparisons. This option is valuable for understanding how alterations to columns may influence data operations, ensuring that users stay ahead of potential data challenges.
4) Add to Impact Analysis
This versatile feature empowers users to handpick specific objects and seamlessly include them in an impact analysis. Users have the freedom to select objects that are of particular interest or concern, tailoring an impact analysis to the precise needs.
Downloading the Comparison results
The user can also download the comparison results by clicking on the download button at the bottom right of the result page. The ability to download schema comparison results in OvalEdge offers users a valuable resource for conducting more accurate and efficient analyses. These downloadable results empower users to delve deeper into data insights, allowing for a comprehensive understanding of schema changes.
Analyzing the Comparison Results
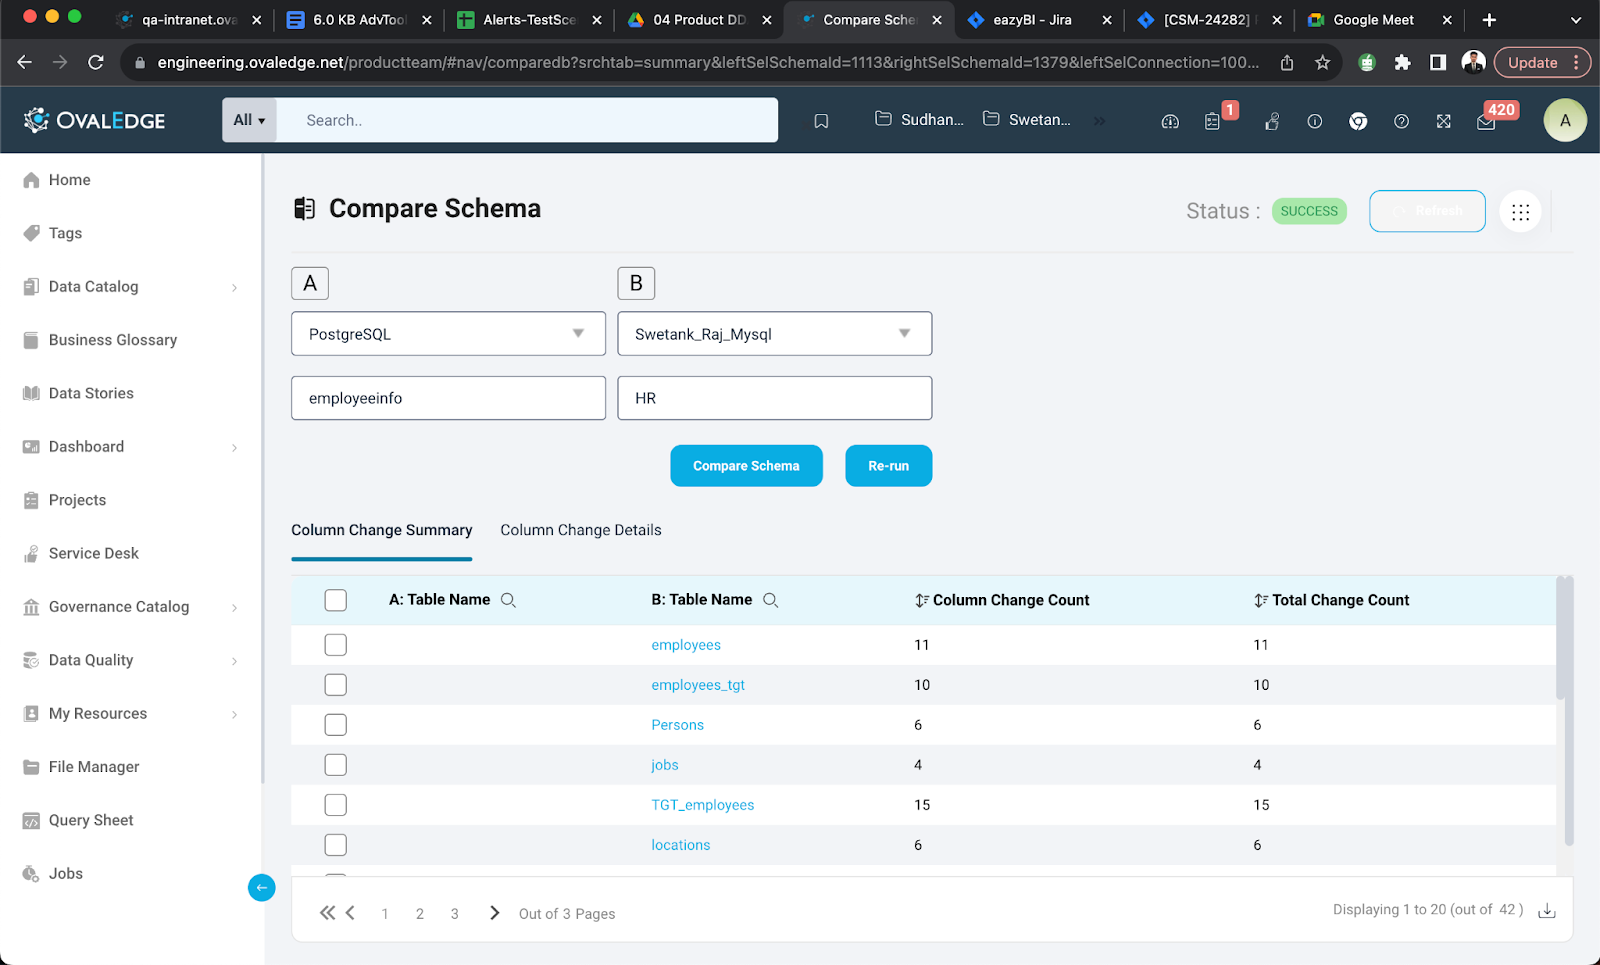
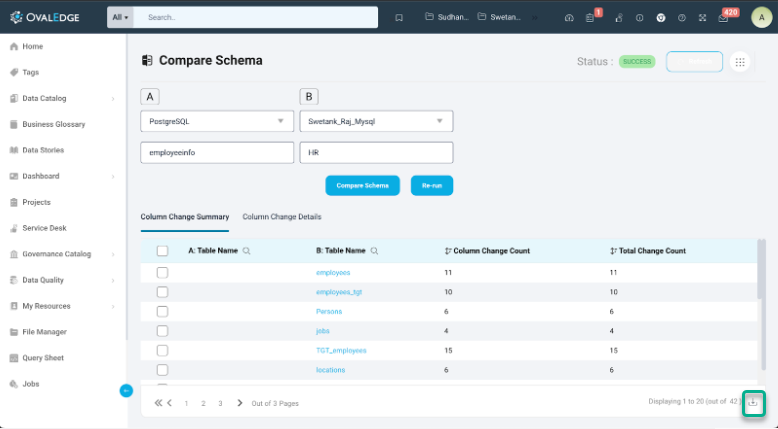
1. Column Change Summary
The Column Change Summary report displays the List of Tables, Column Change Count, and Total Count.
- The Column Change Count shows the total number of columns modified over a period of time.
- The Total Change Count shows the total number of times the columns have been modified over a period of time.
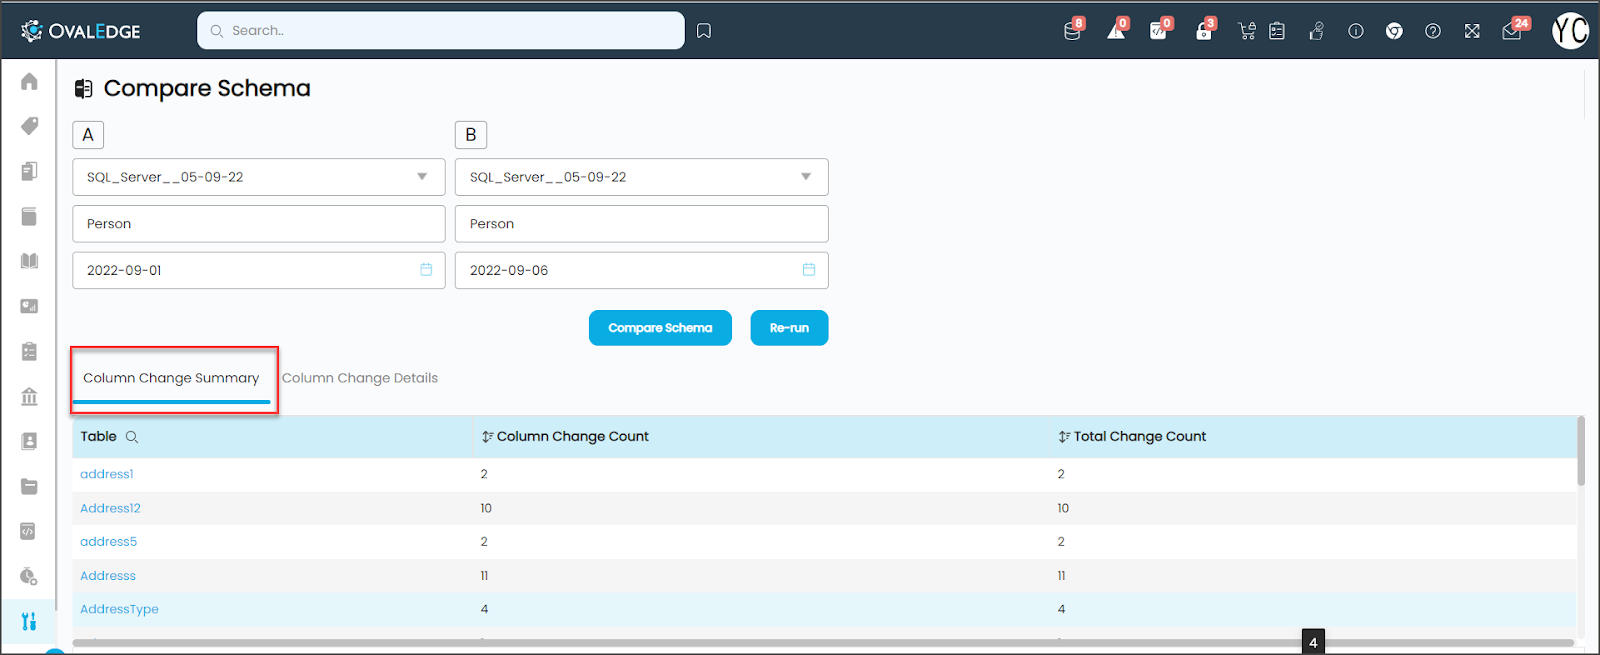
The comparison result shows that the schema ‘Person’ has changed from the date range of 01-09-22 to 05-09-22.
2. Column Change Details
The Details Report displays detailed information about the modified Schema ‘Person’. It displays the Compare ID, Table Name, Column Name, Column Type and Column Length from Source and Target connections. The column names are compared individually, and the changes in the column attributes are displayed. The report also displays the action date and action taken. The action of modification is Added, Deleted, and Modified. Users can apply the filter option to see a record based on the type of action taken.
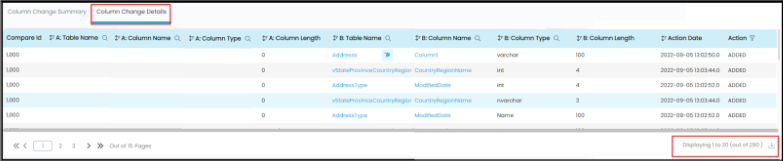
The comparison result shows that the schema ‘Person’ has changed with detailed analysis for the period of 01-09-22 to 05-09-22.
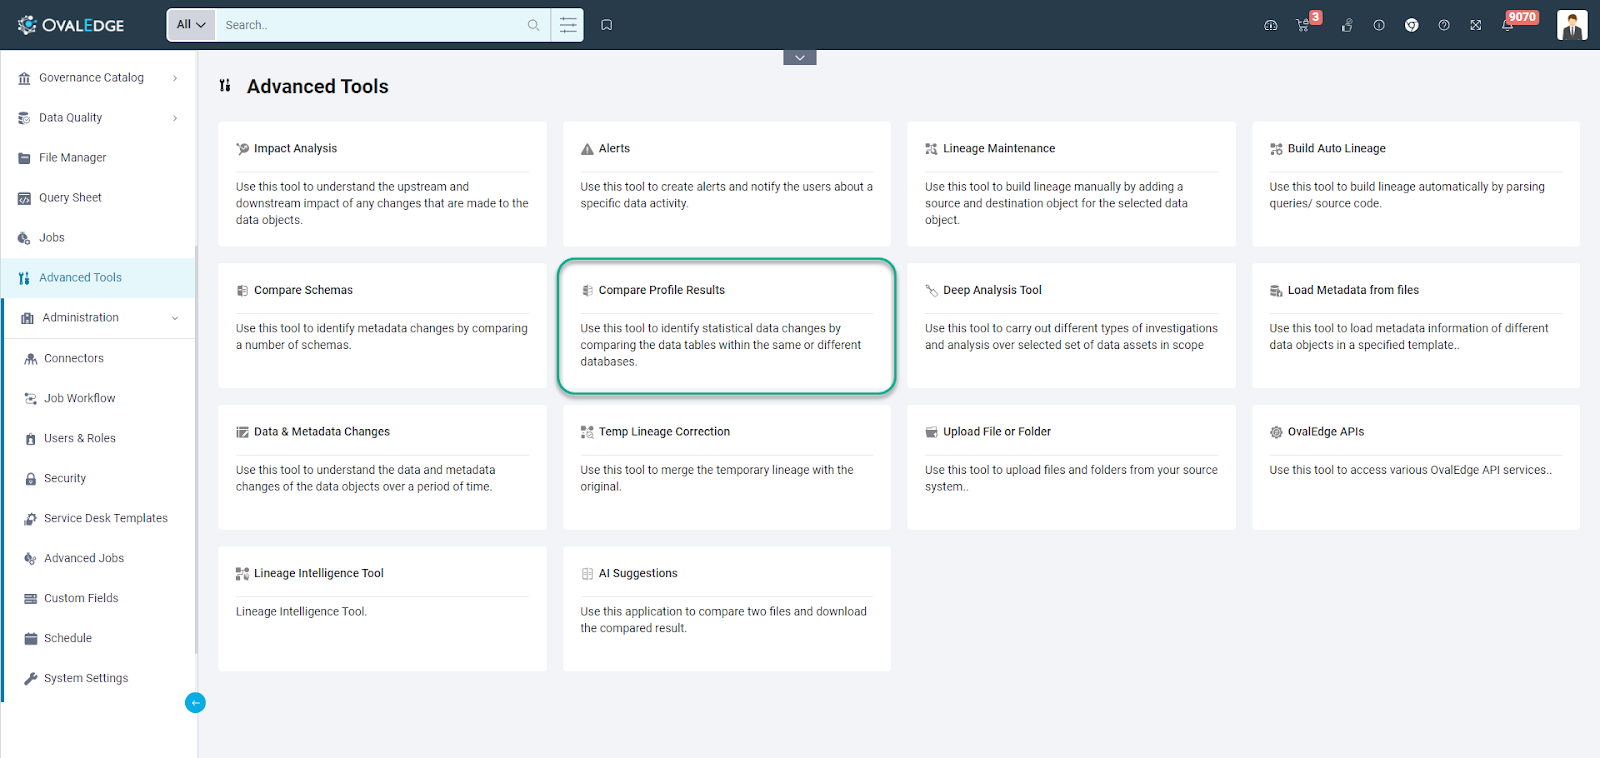
Compare Profile Results
Profile Comparison Results
The Compare Profile Result provides the ability to view how the data changes from one profiling session to another and allows users to compare two data tables, between different profile periods, to report the modifications in:
- Column Names
- Column Properties
- Column Attributes
- Column Statistics
The changes between the compared tables appear in a grid and are highlighted for easy review. The count of the data changes, such as null count, distinct count, top values, and minimum and maximum values, are listed on this page. Additionally, changes in the popularity and importance scores of the compared tables are displayed for reference.
Use of Profile comparison
Profile comparison is a versatile tool used for:
- Data quality assessment
- Data integration and transformation
- Anomaly detection
- Security and fraud detection
- Machine learning and pattern recognition
- Document comparison and plagiarism detection
It helps identify differences, similarities, and anomalies in various data profiles, supporting data analysis and informed decision-making in multiple domains.
Navigating Compare Profile Results
Users can access the Compare Profile Results module in OvalEdge by clicking on the Advanced Tools tab, provided they have the necessary permissions, i.e., an Author user with Metadata Write permissions. Within Advanced Tools, the Compare Profile Results tab is available, allowing users to seamlessly navigate to this module.
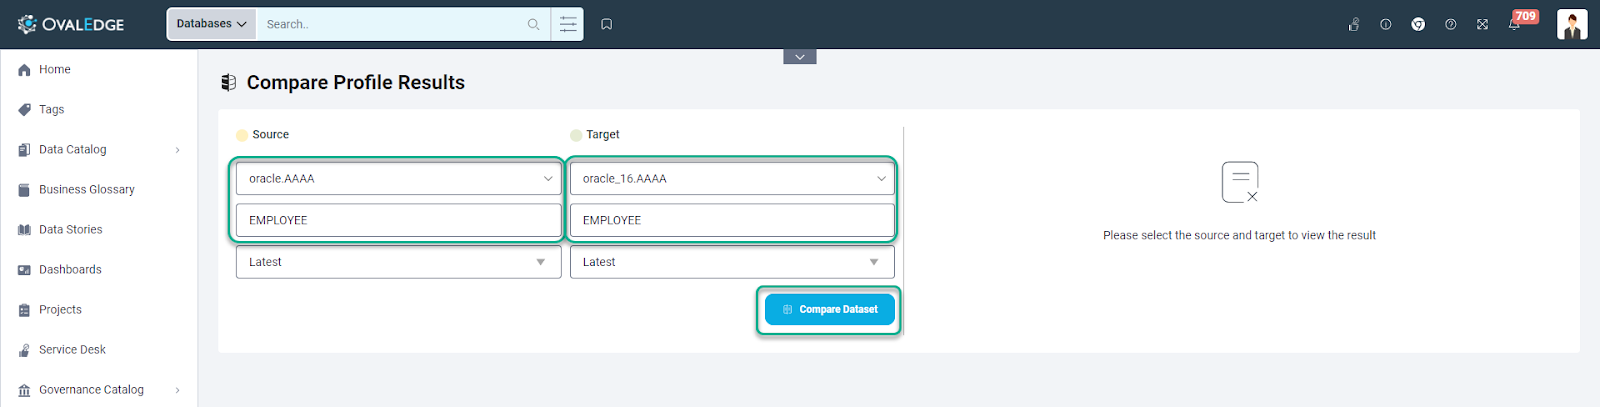
Providing Input for Comparison
To perform profile comparisons across connectors, users are required to provide specific input details to guide the comparison process effectively. Here's a breakdown of the key input fields:
- Connector A: Users initiate the profile comparison by selecting the name of the connector where the first table of interest resides. This acts as the reference point for the comparison.
- Table A: Next, users pinpoint the specific table they wish to compare within Connector A. This selection establishes the foundation for analyzing profile changes.
- Timestamp for Table A: it is imperative to specify the date associated with Table A. This time stamp is vital in defining the period under scrutiny for the comparison. The dropdown will consist of all the profiled dates.
- Connector B: In parallel, users also need to identify the connector where the second table, which they intend to compare, is located. This connector serves as the point of reference for the second table.
- Table B: Users are prompted to select the Table from Connector B that they wish to compare. This completes the framework for a comprehensive profile analysis.
- Timestamp for Table B: The completion of the comparison framework involves the input of the end date for Table B. This date acts as the culmination point of the time interval under examination.
After inputting all the details, users can initiate the Comparison job by clicking on the Compare Dataset button.
Analyzing the Compared Results
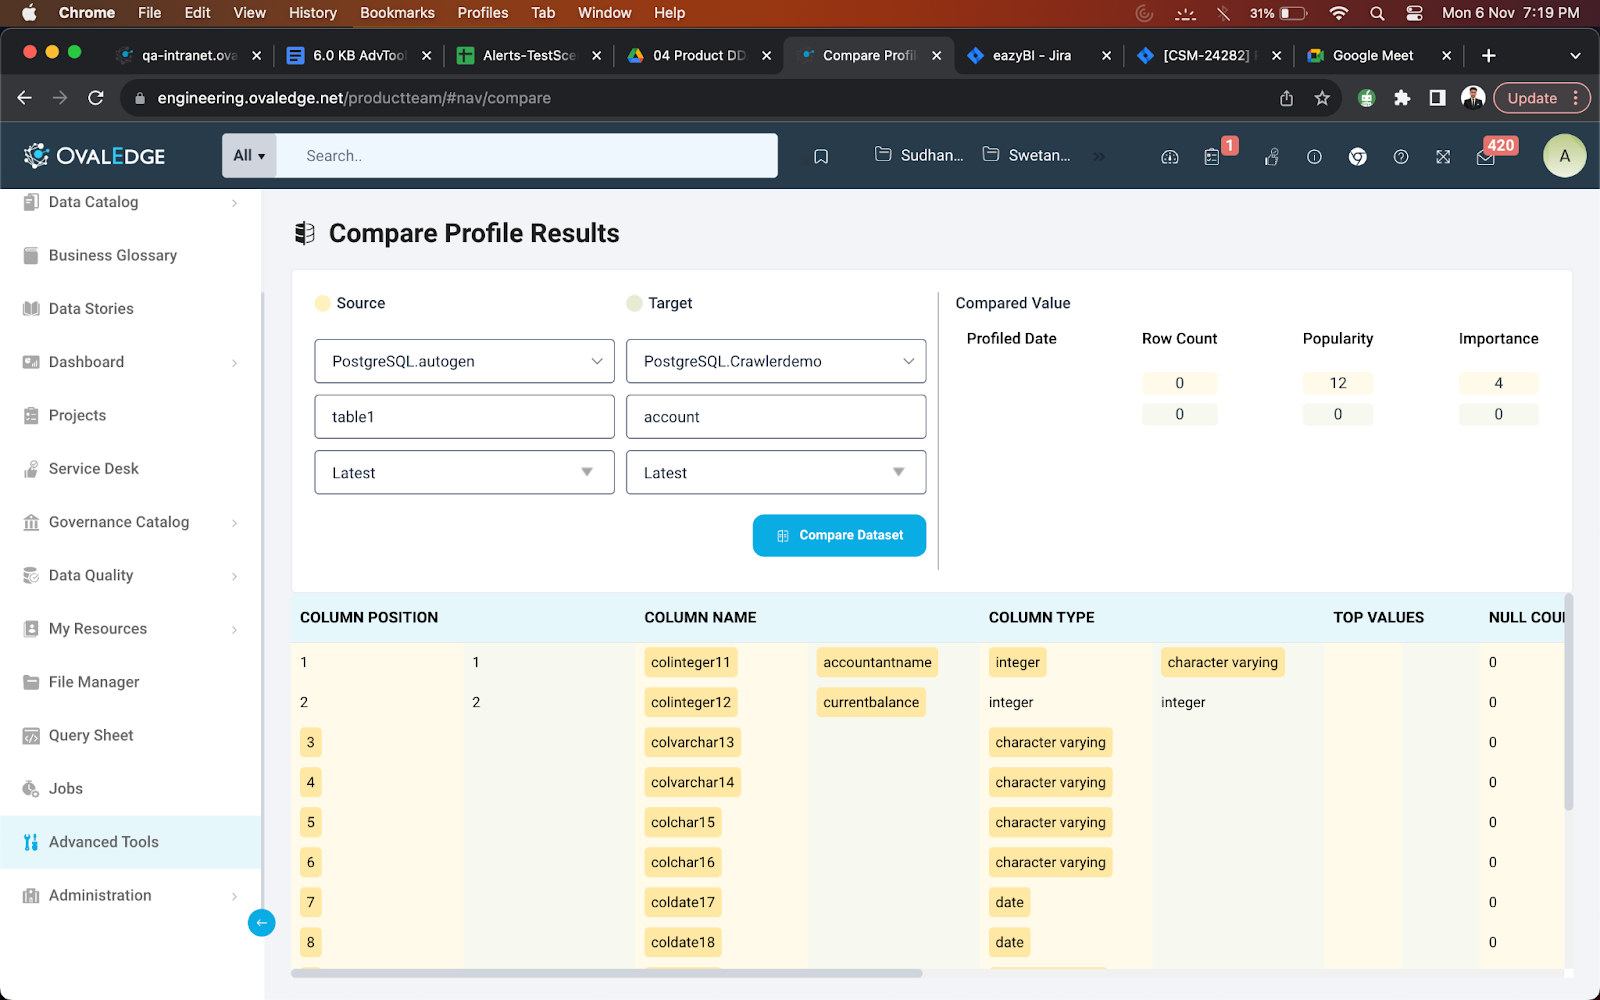
When a user clicks on the Compare Dataset button, the results from the comparison are displayed in a table, details from the Source are on the left and the source Target to the right. The column names are compared individually, and the changes in the column attributes are displayed.
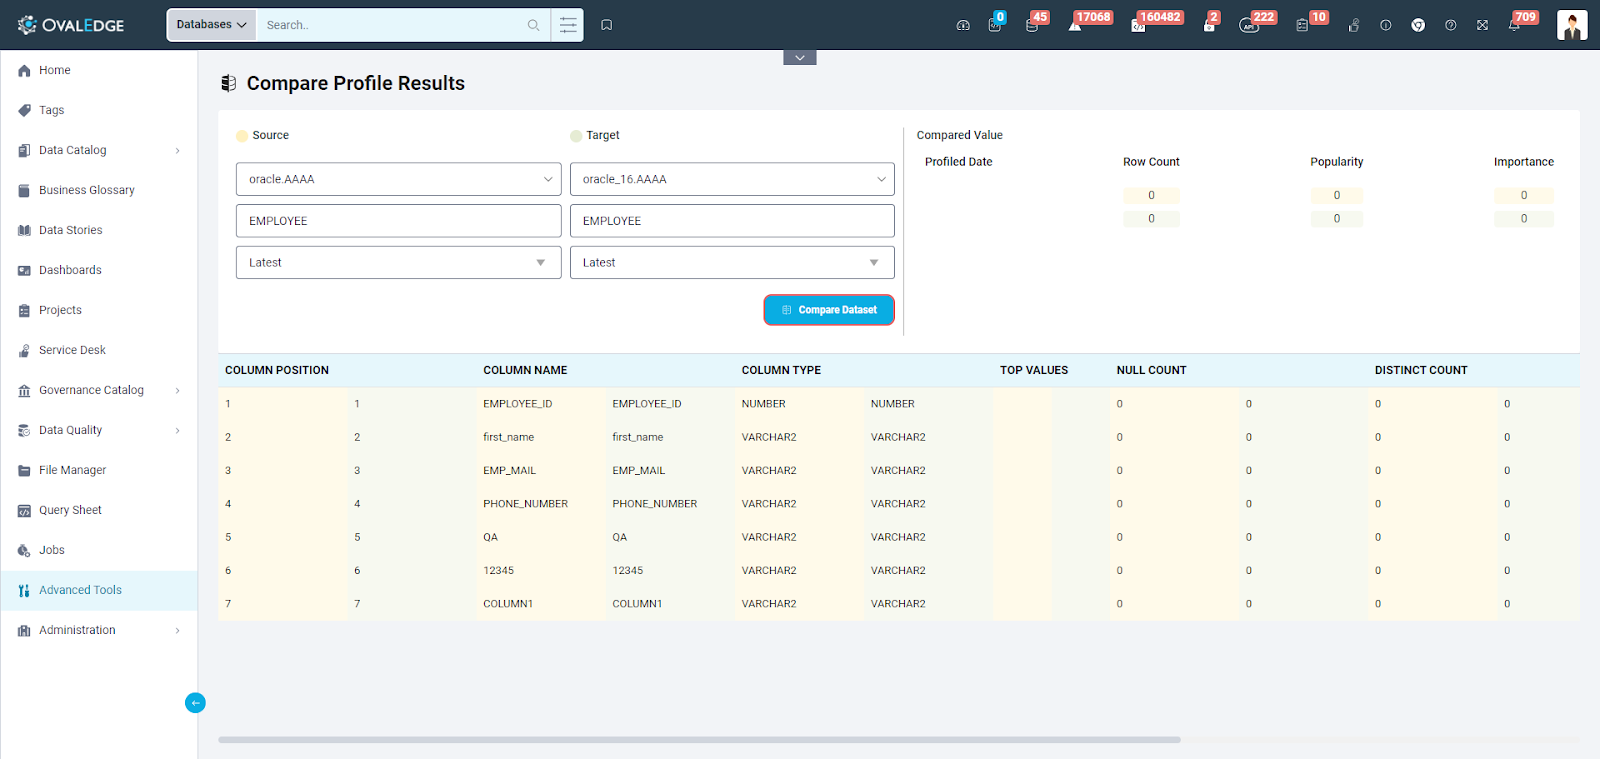
Compare Profile Results will give comparison details between the two profile dates:
- Profile Date: It will display the previous and latest date selected to compare
- Row Count: It will display the row count updated during the profiling
- Popularity: It will display popularity updated during the profiling
- Importance: It will display popularity updated during the profiling
The tabular result will display the following:
|
Sl.No |
Result Column |
Description |
|---|---|---|
|
1 |
Column Position |
It is the order of a column in that table. There are 3 rows in the source column and 4 in the Target column details. The difference between the two columns is highlighted. |
|
2 |
Column Name |
It displays the column names from both the schema/table. |
|
3 |
Column Type |
It describes the data types (VARCHAR, INT) |
|
4 |
Statistical information |
Top Value, Null Count, Distinct Count, Minimum Value, and Maximum Value. |